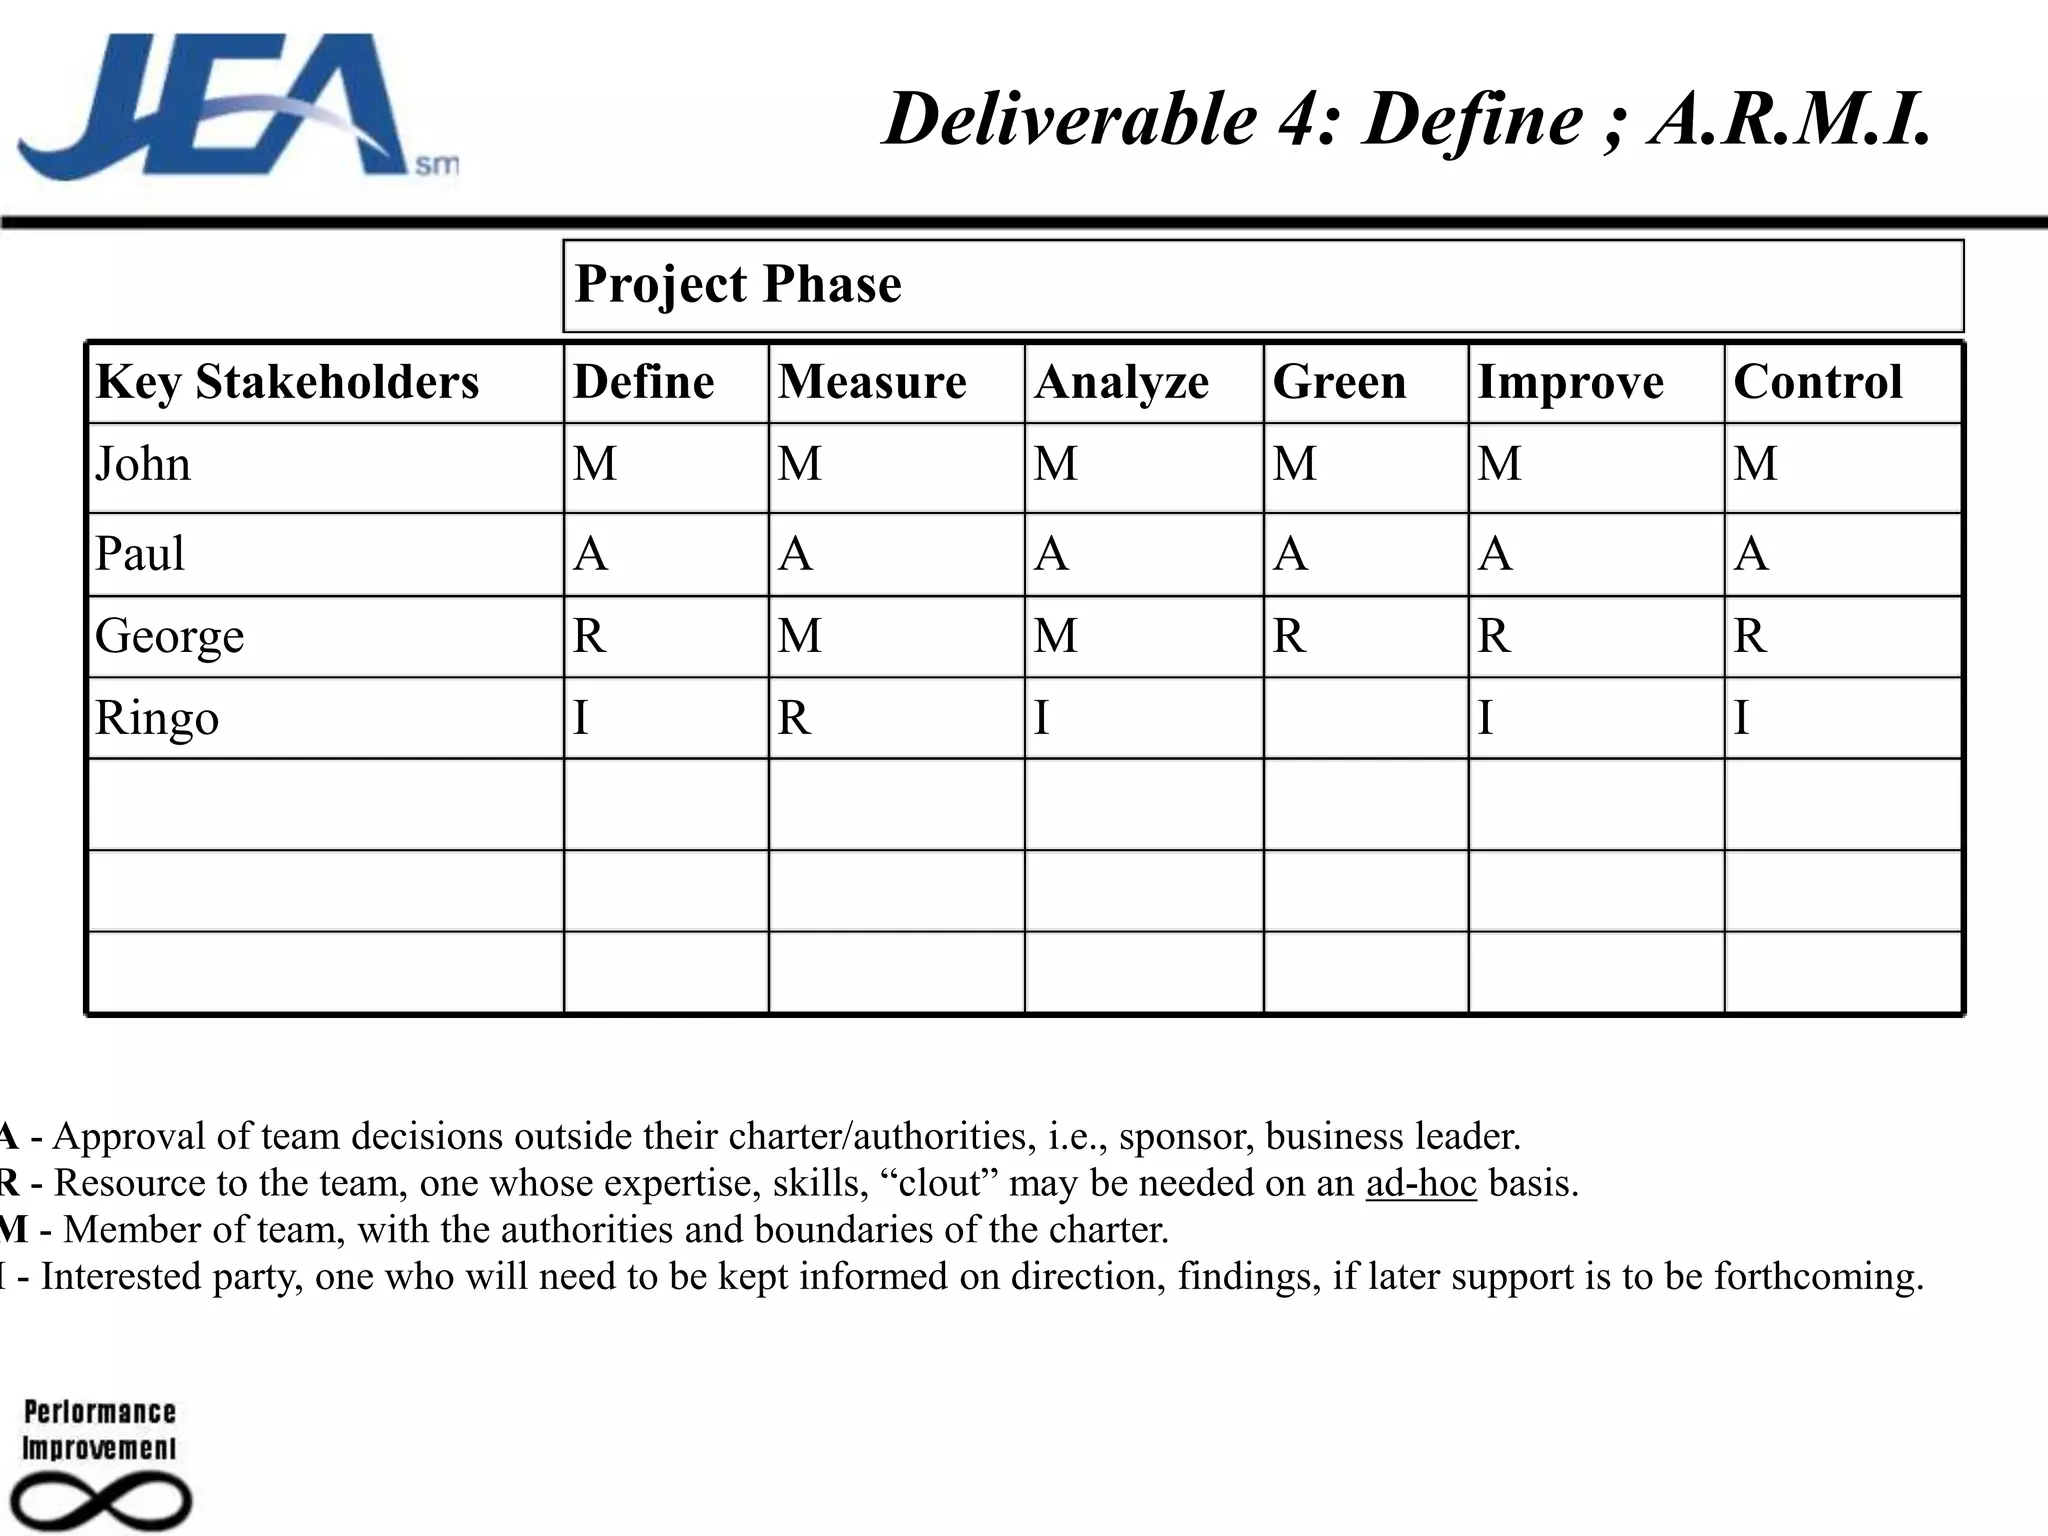
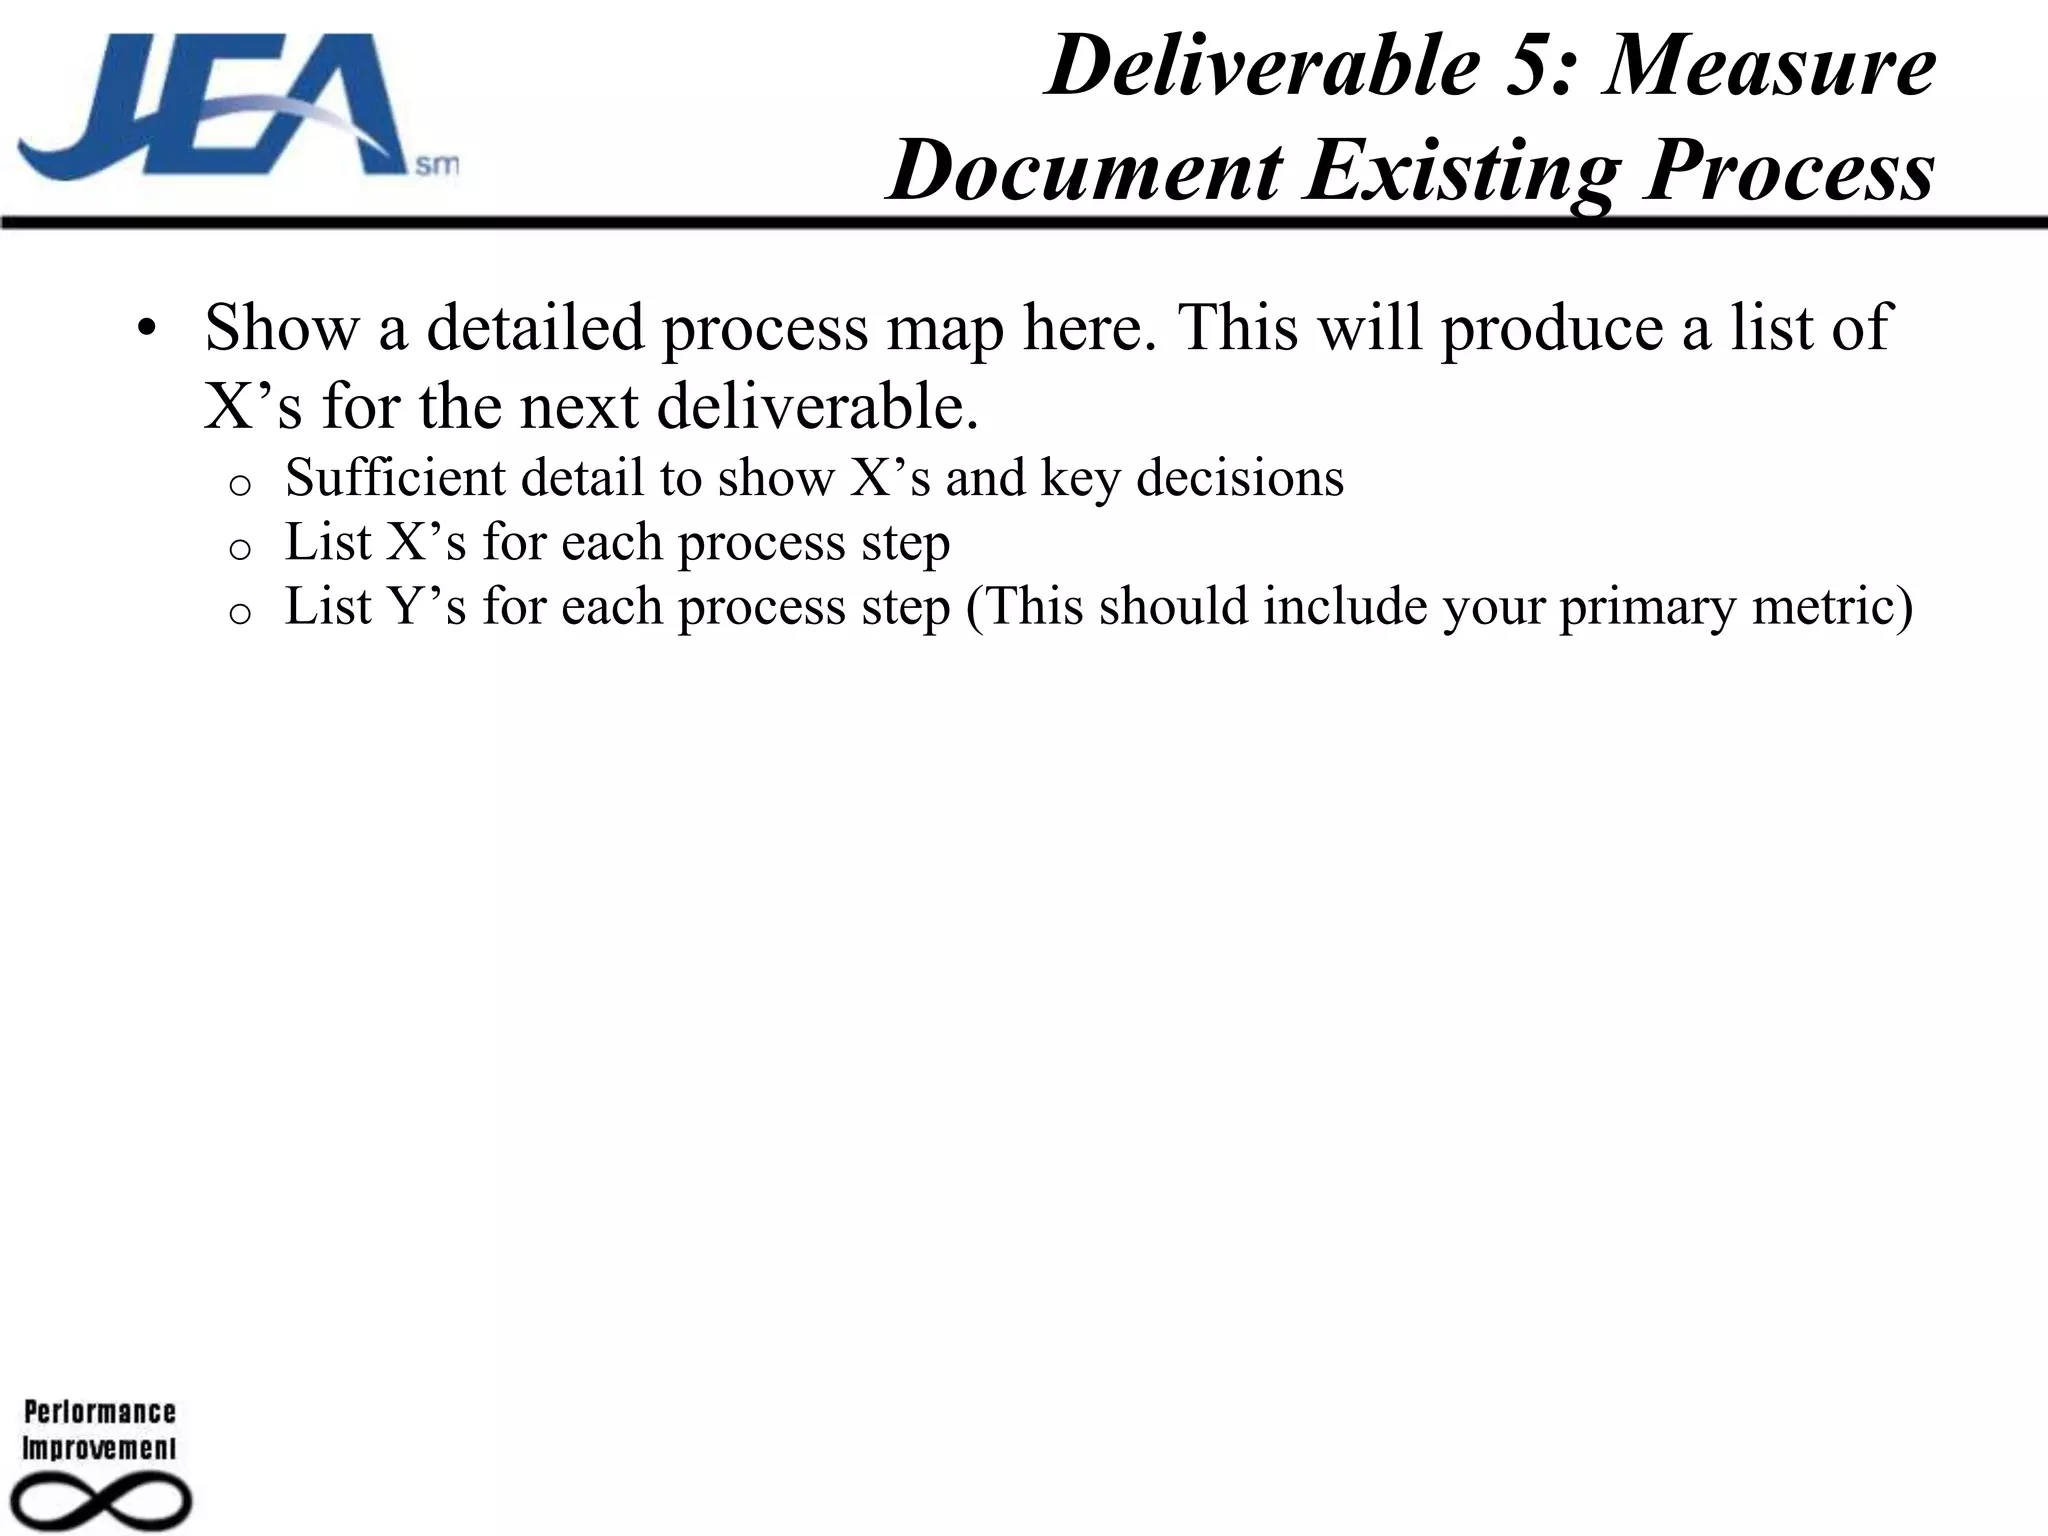
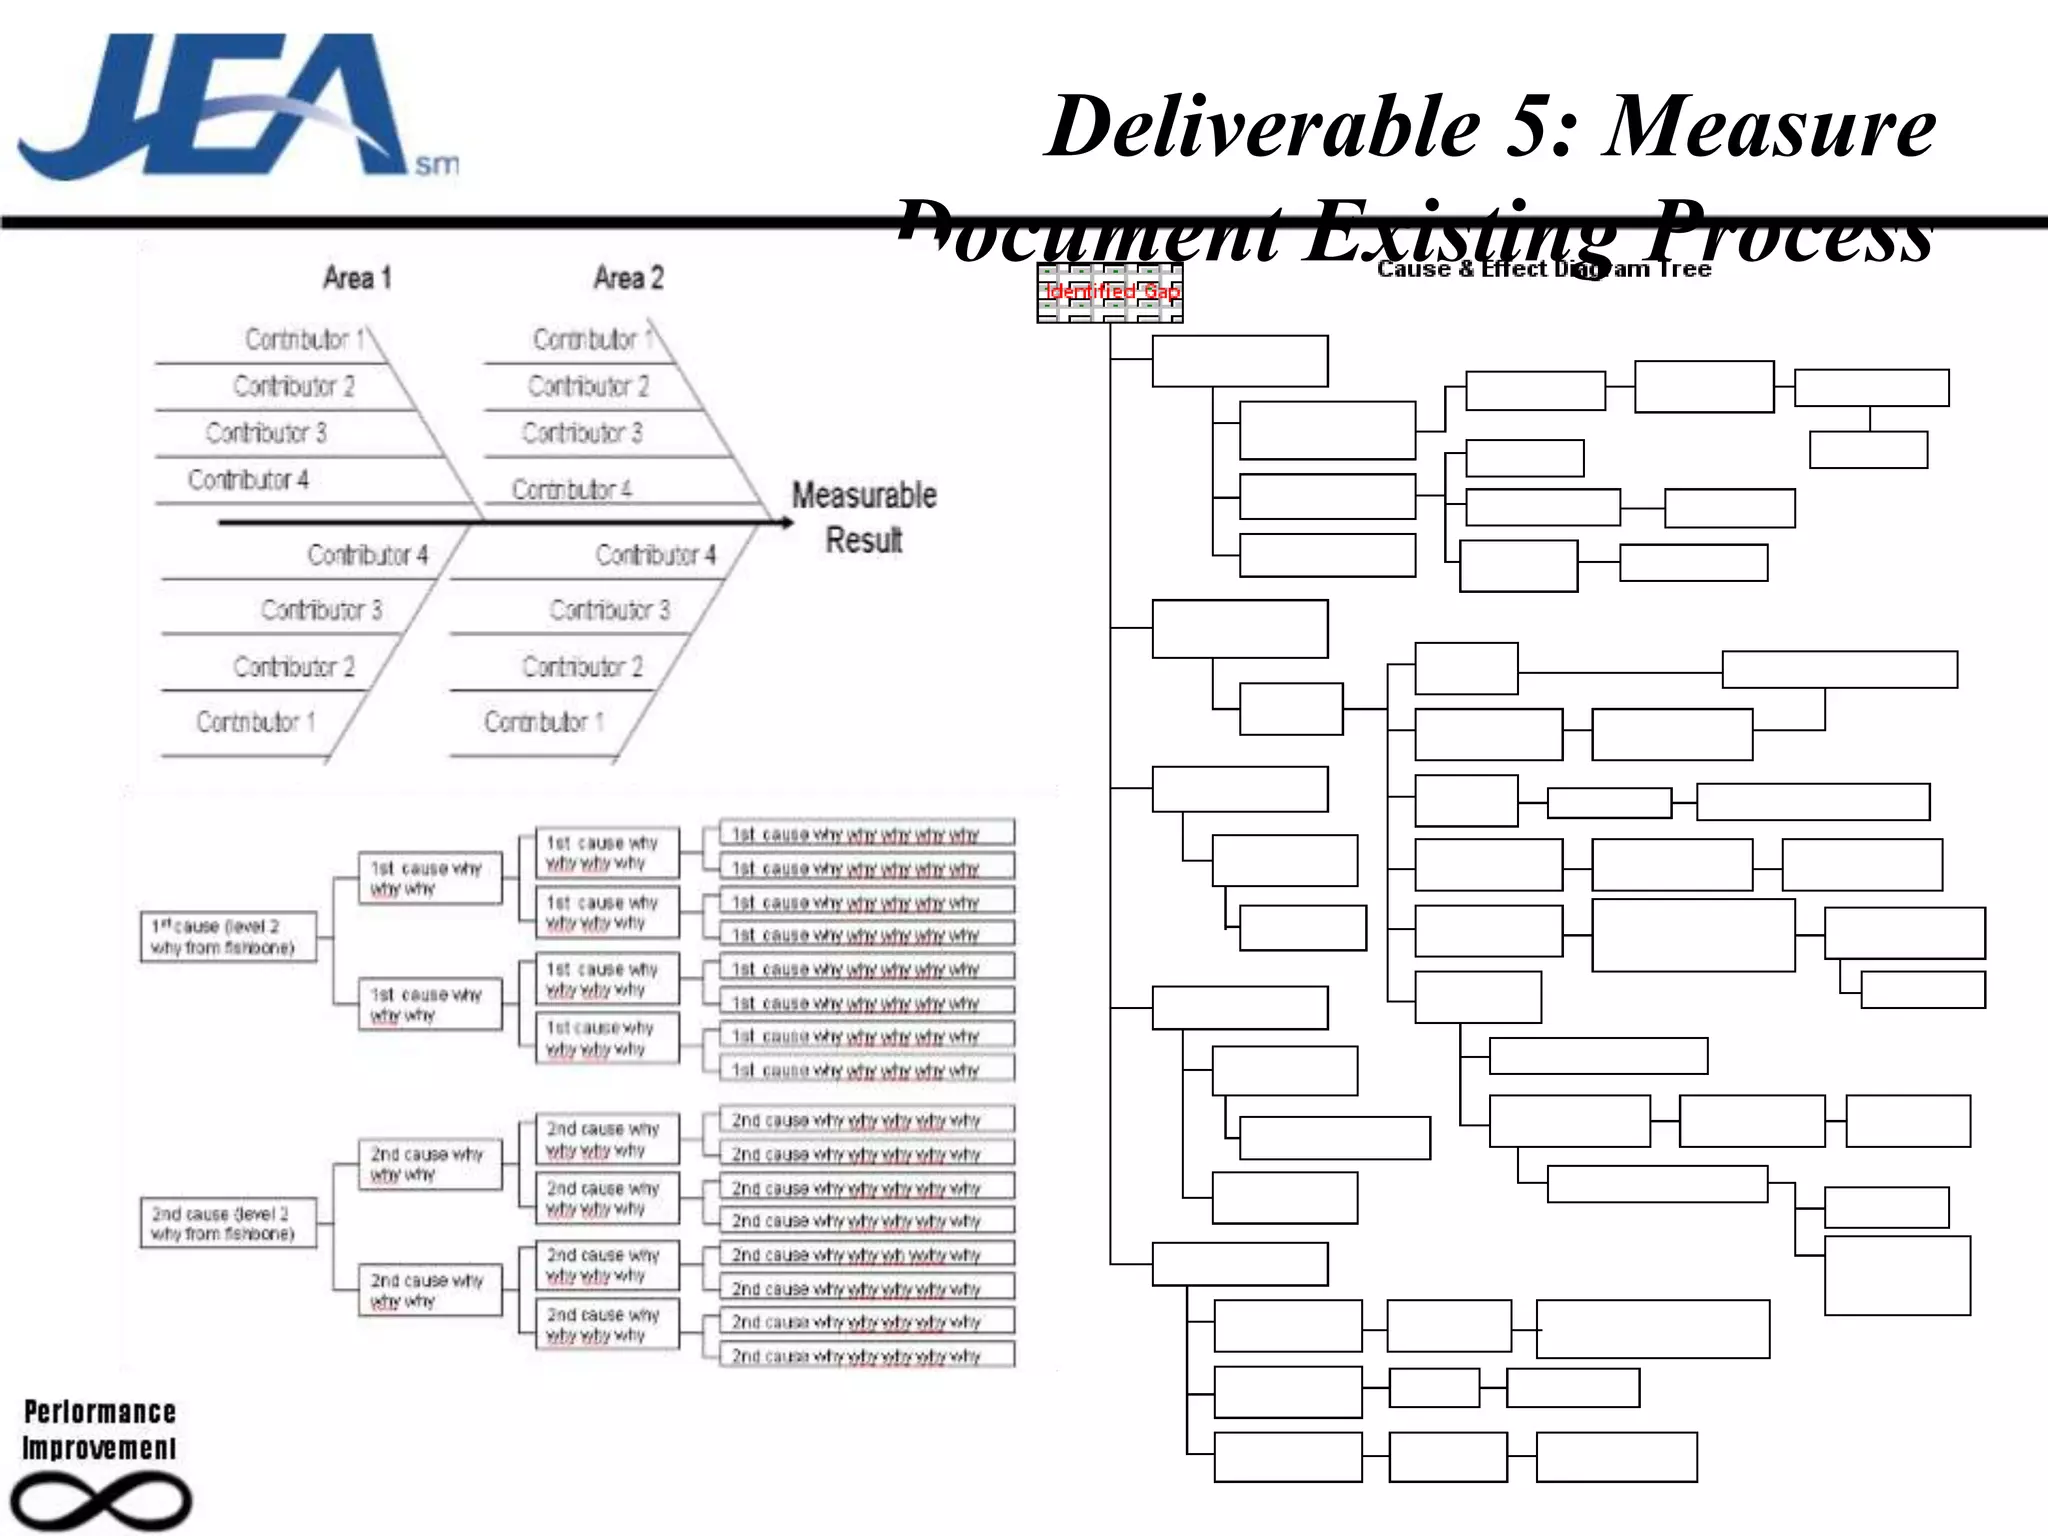
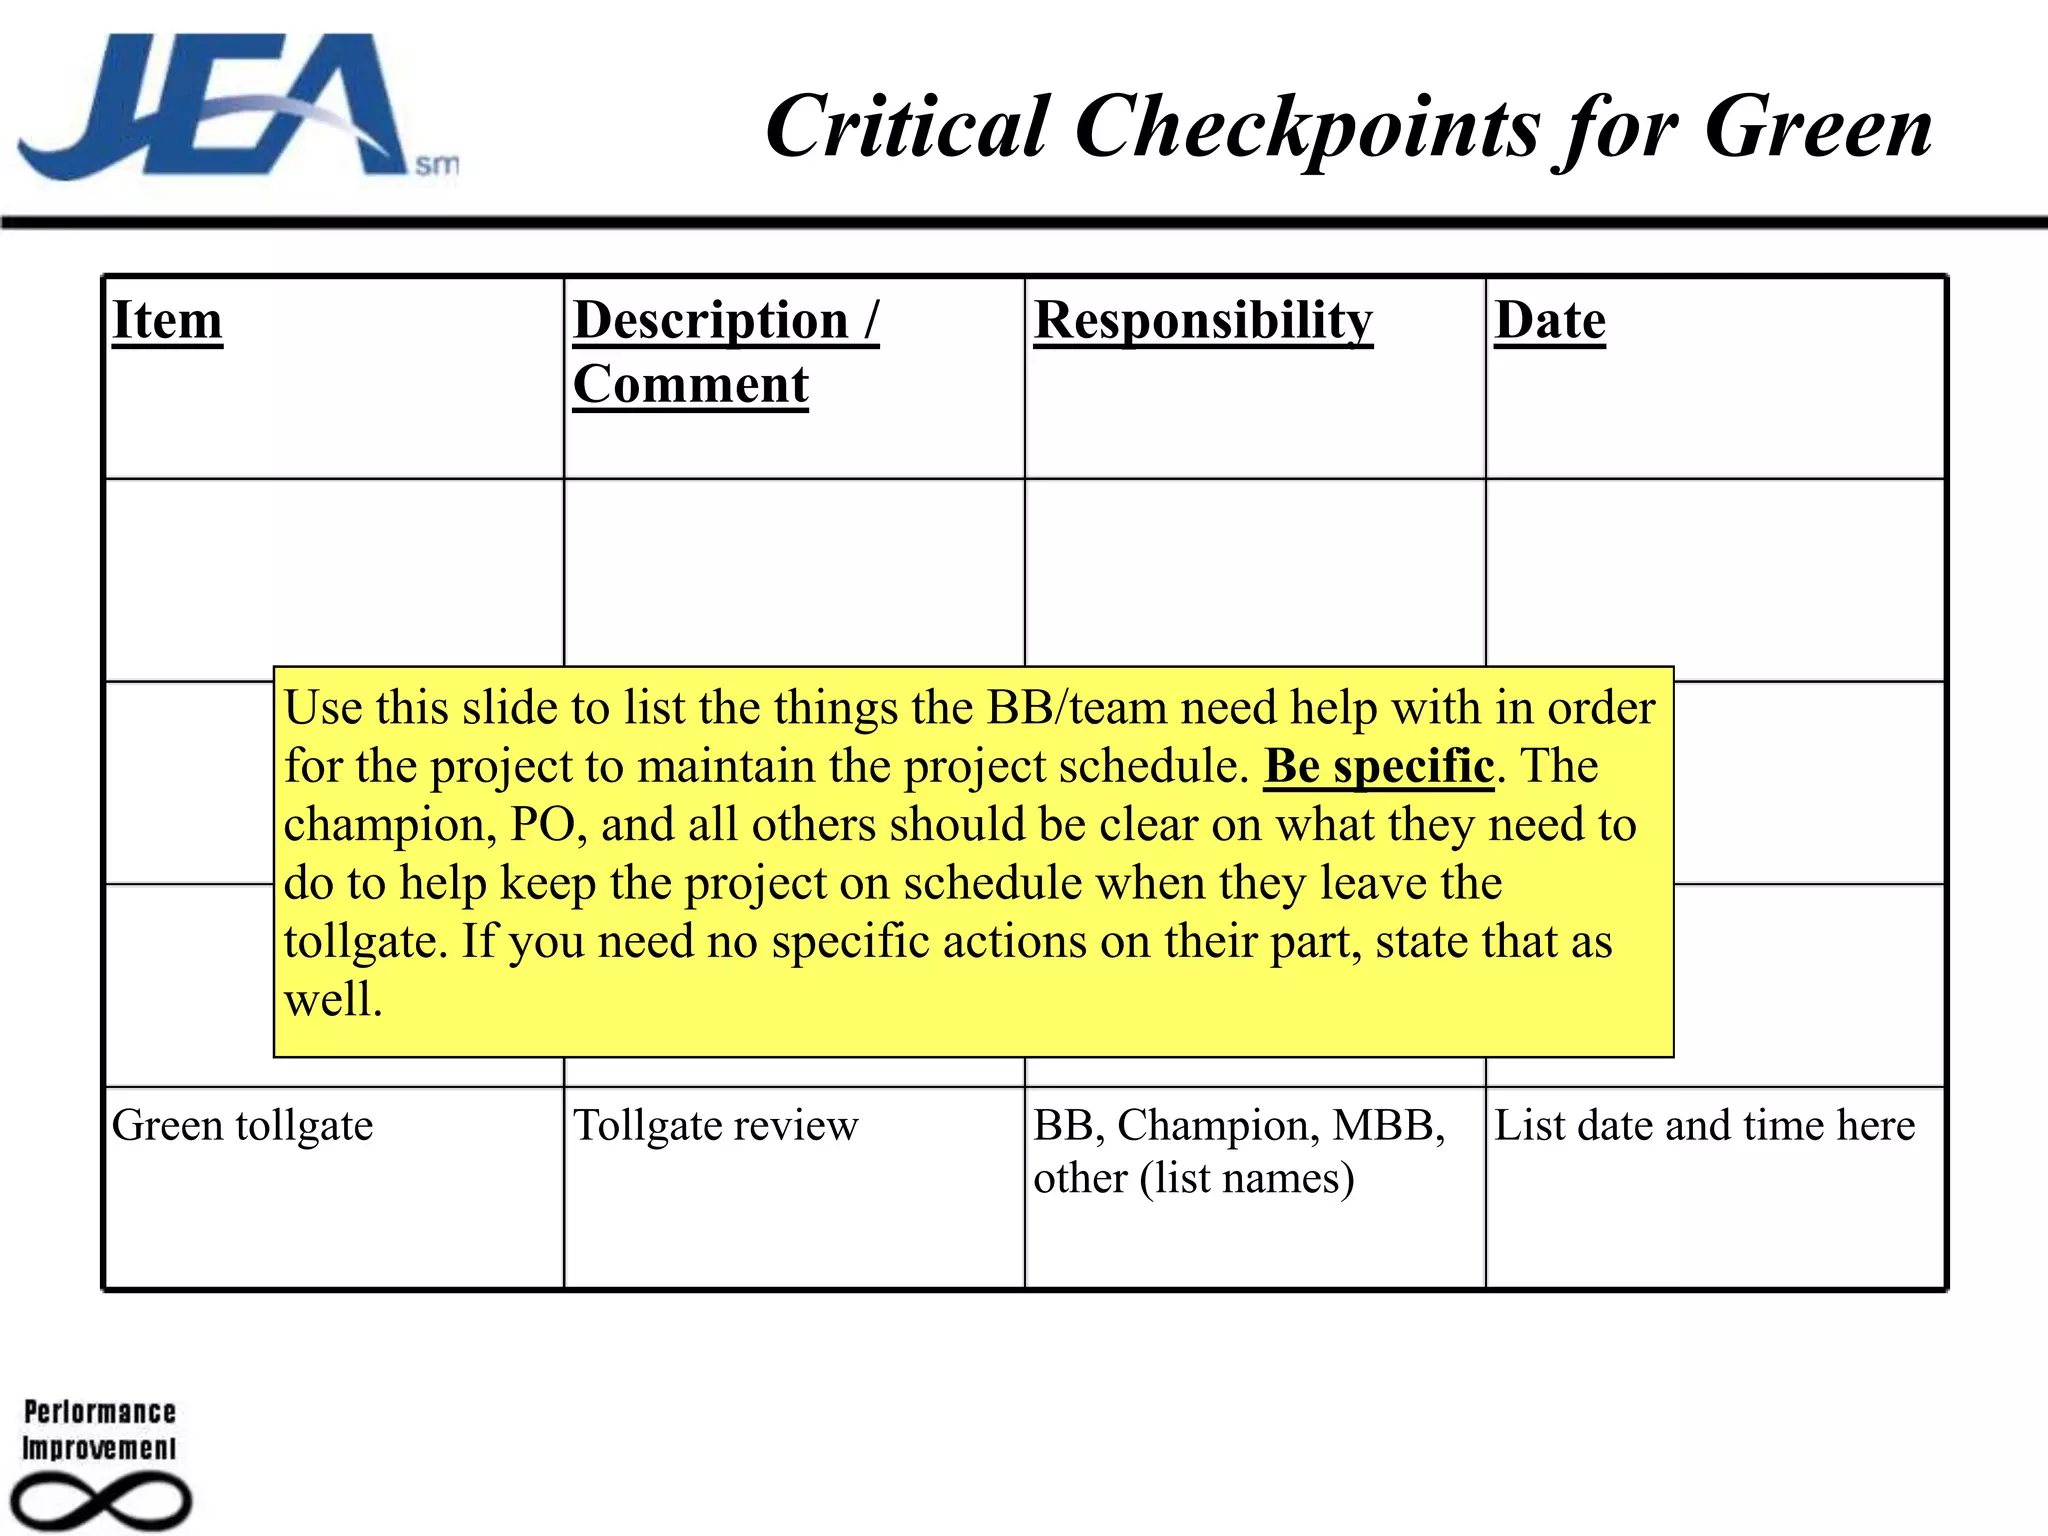
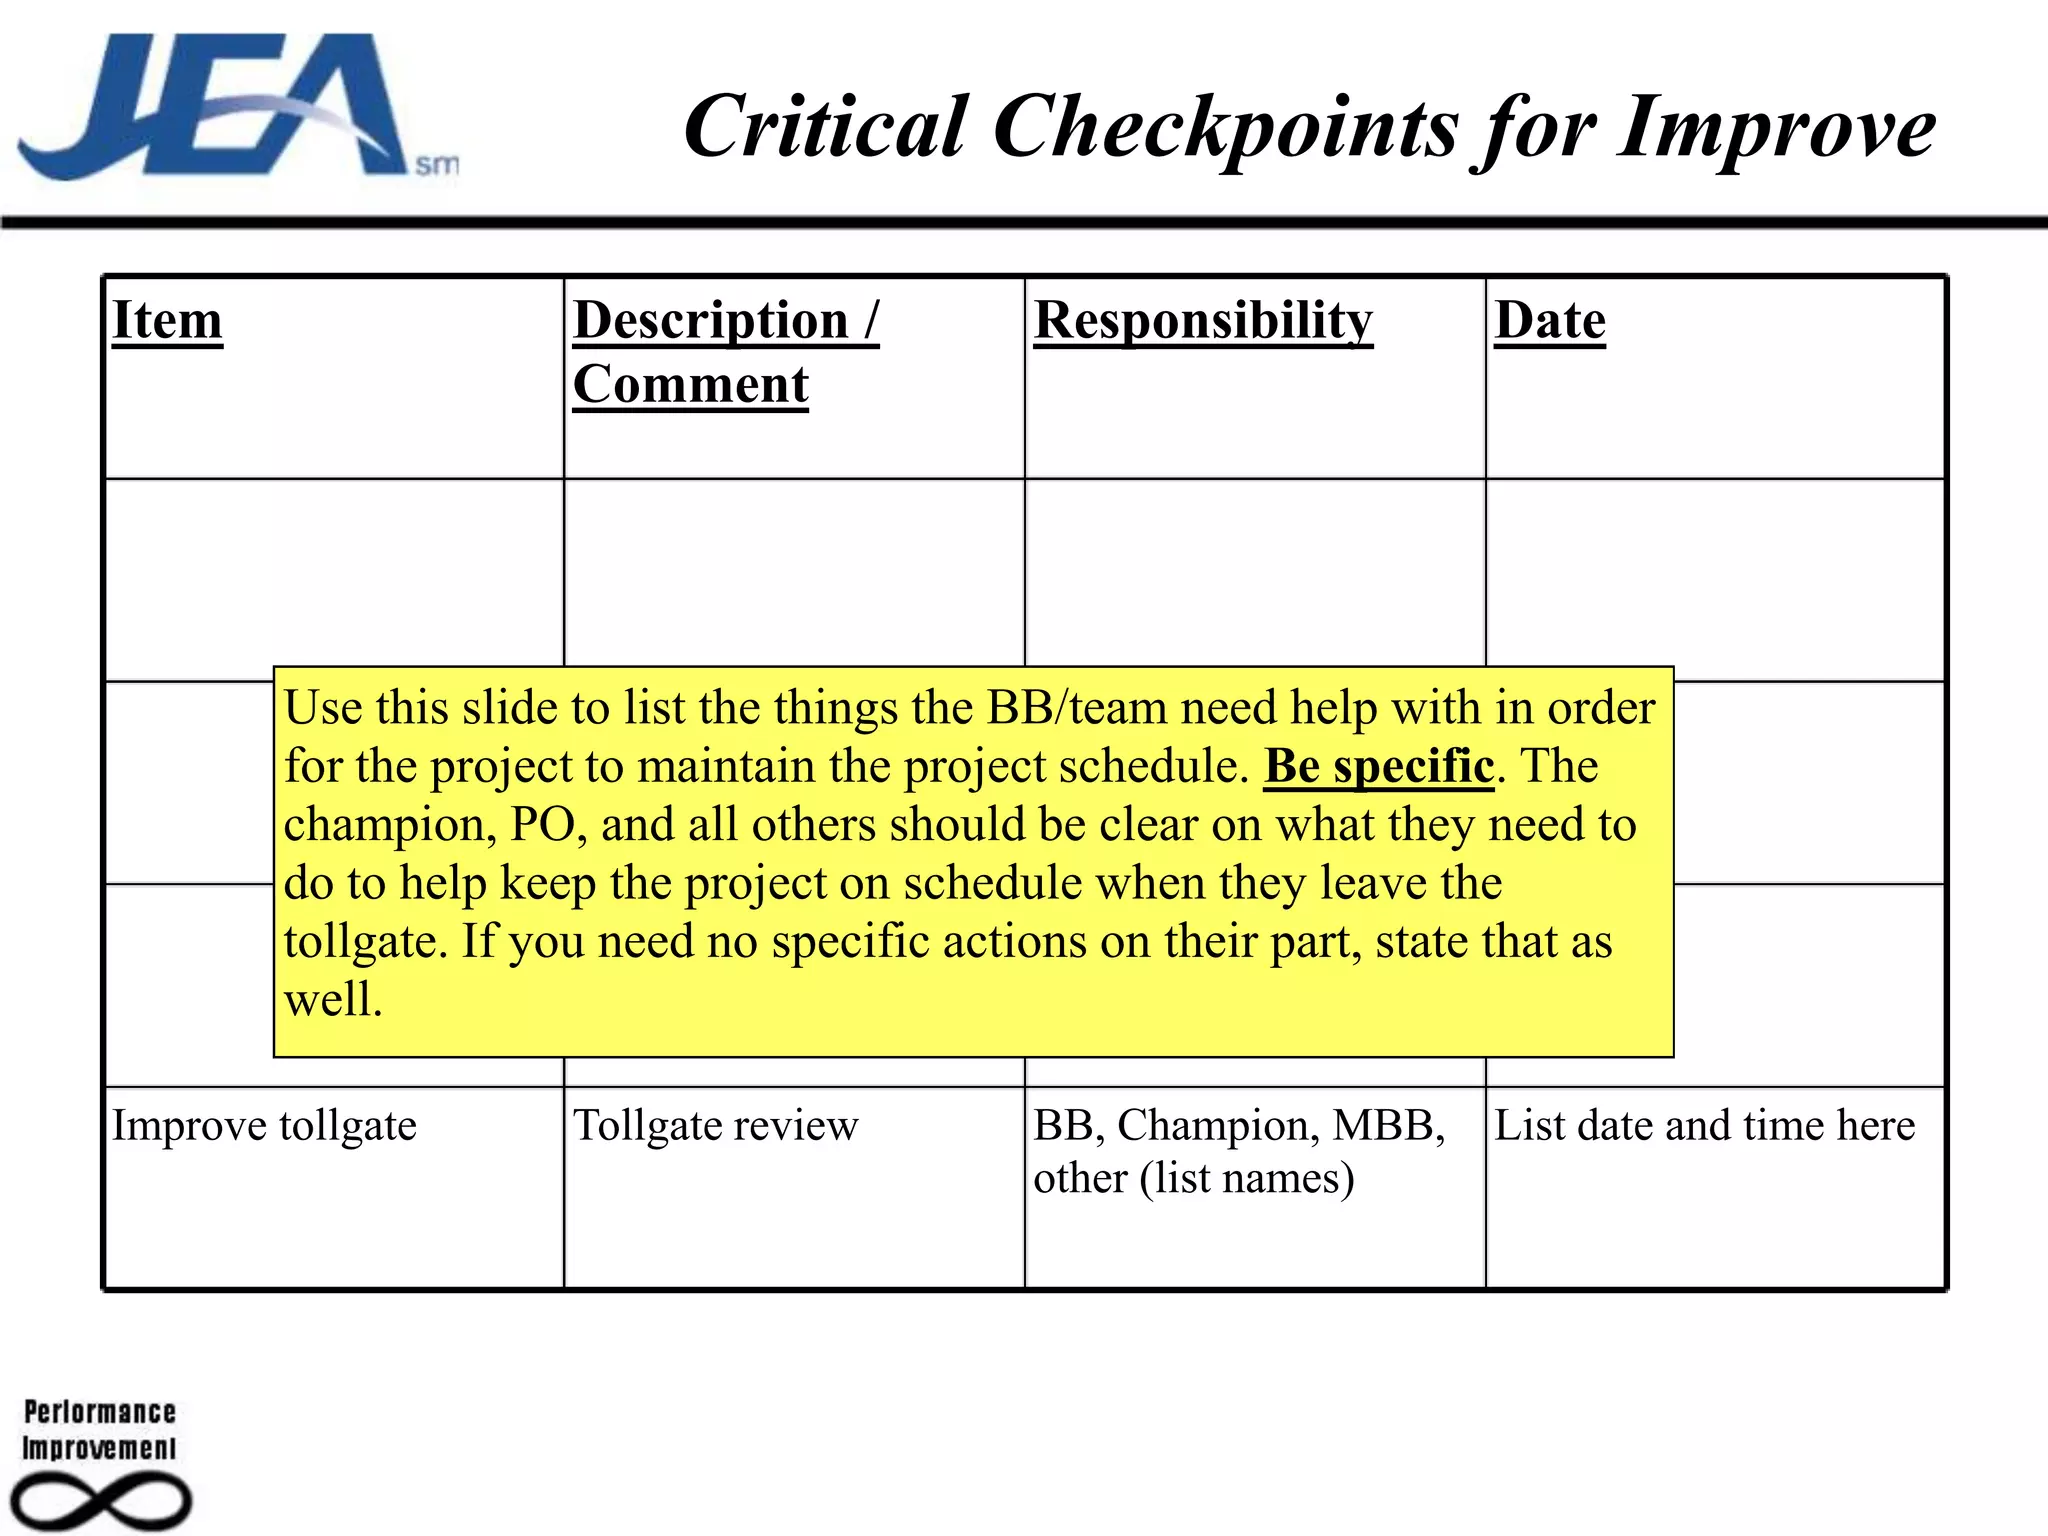
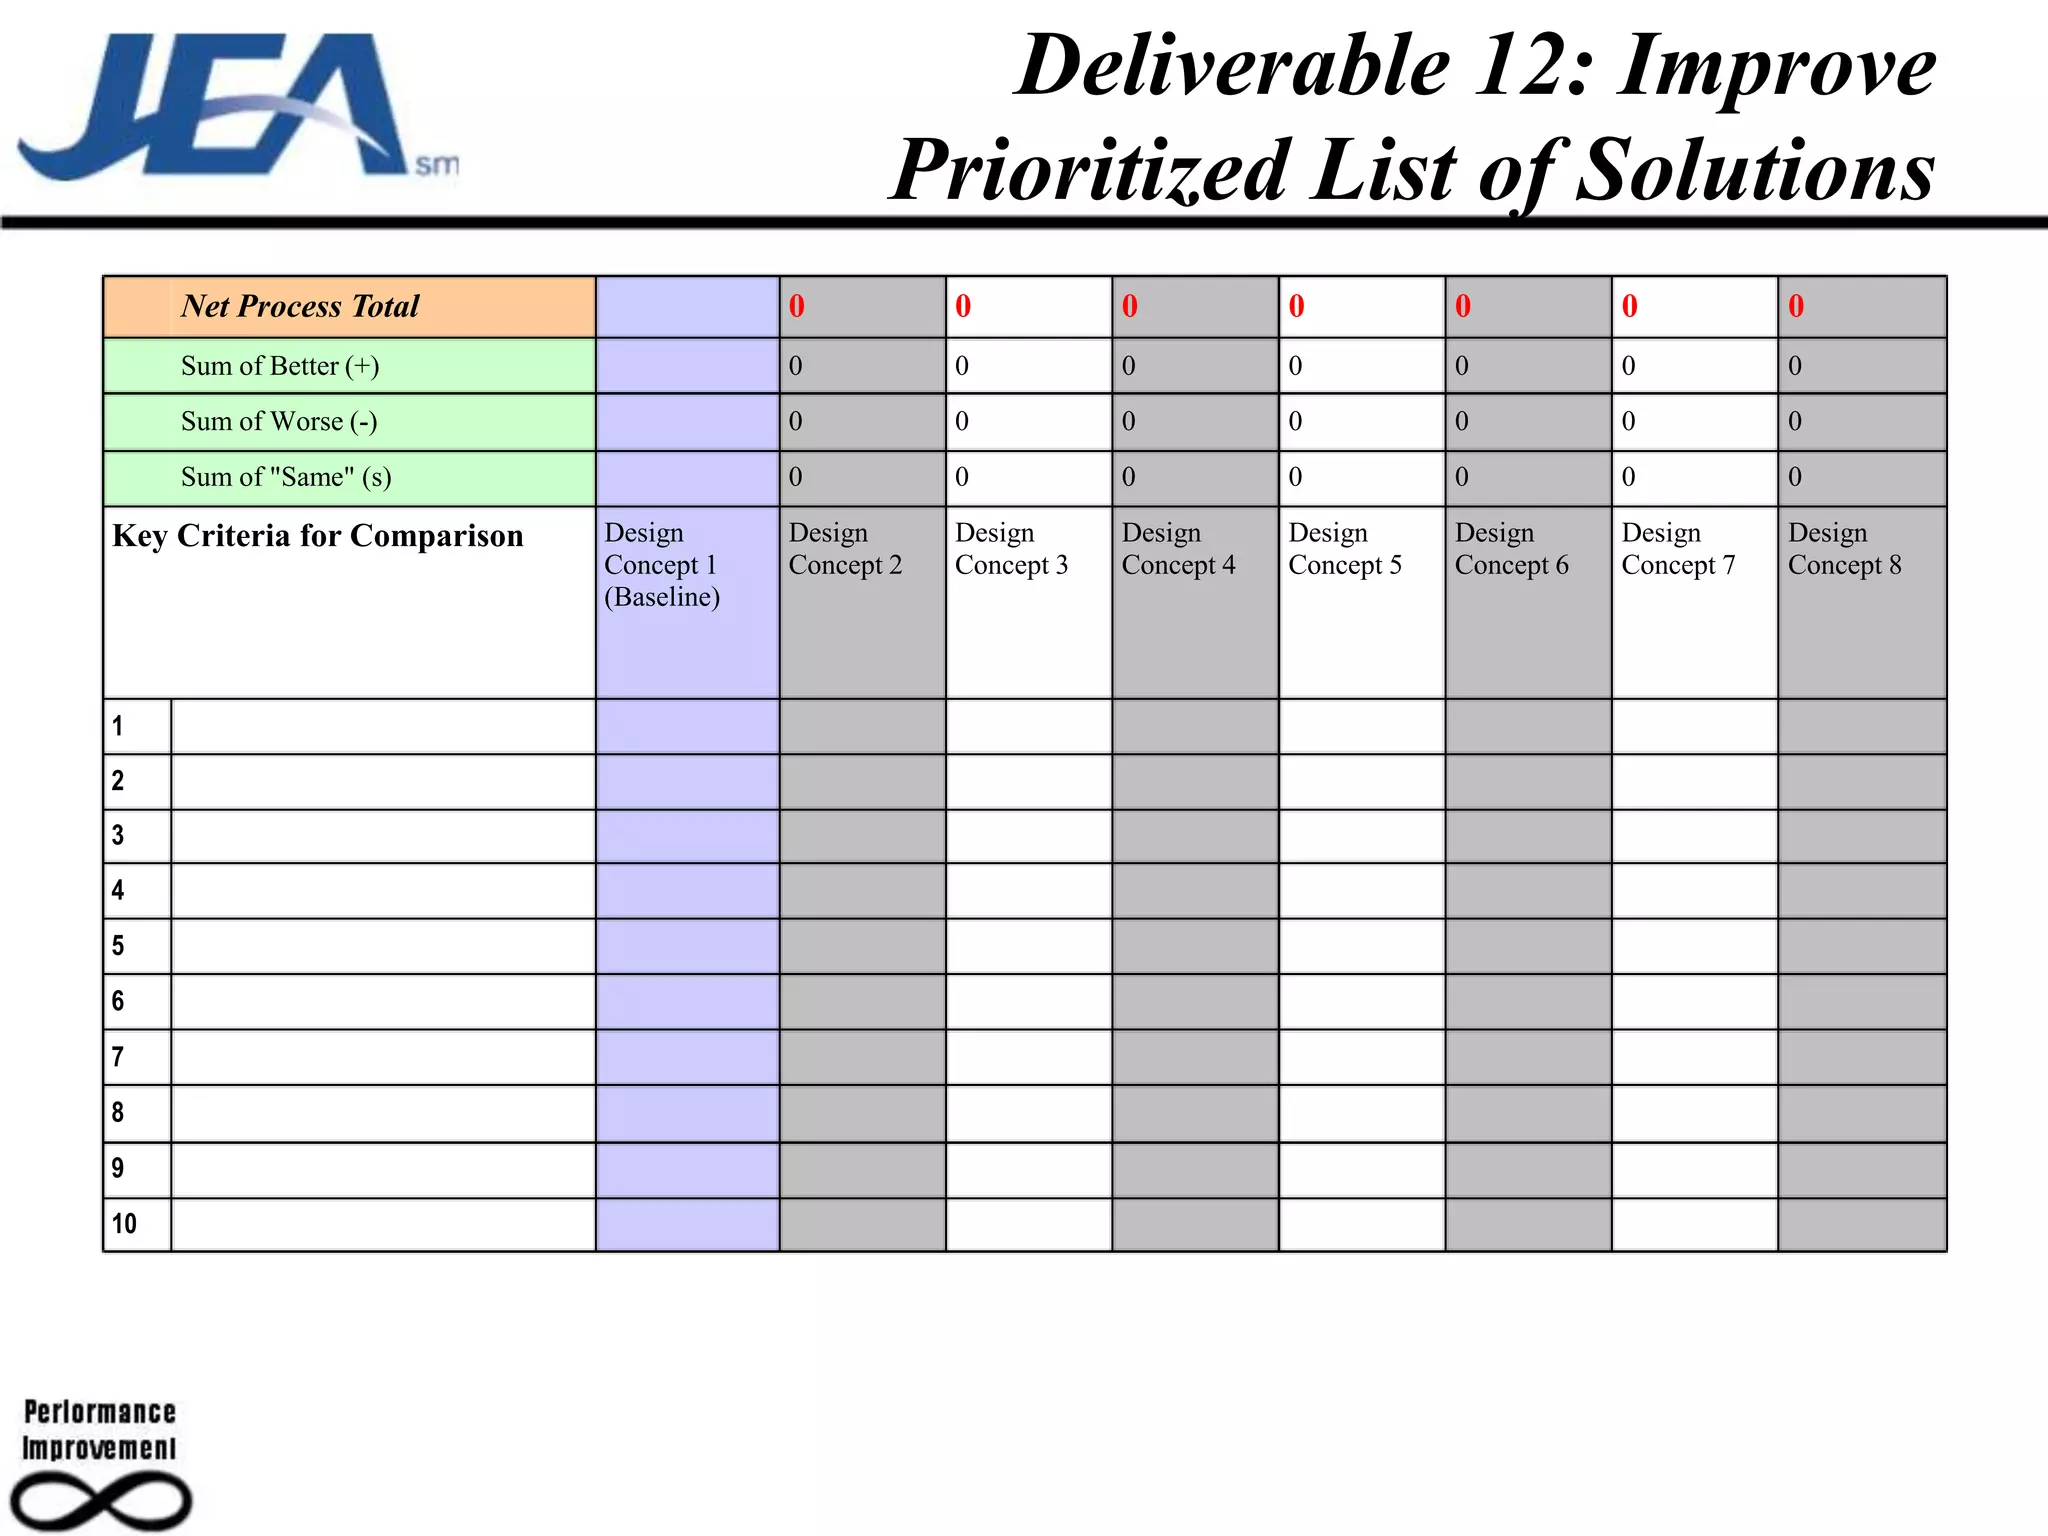
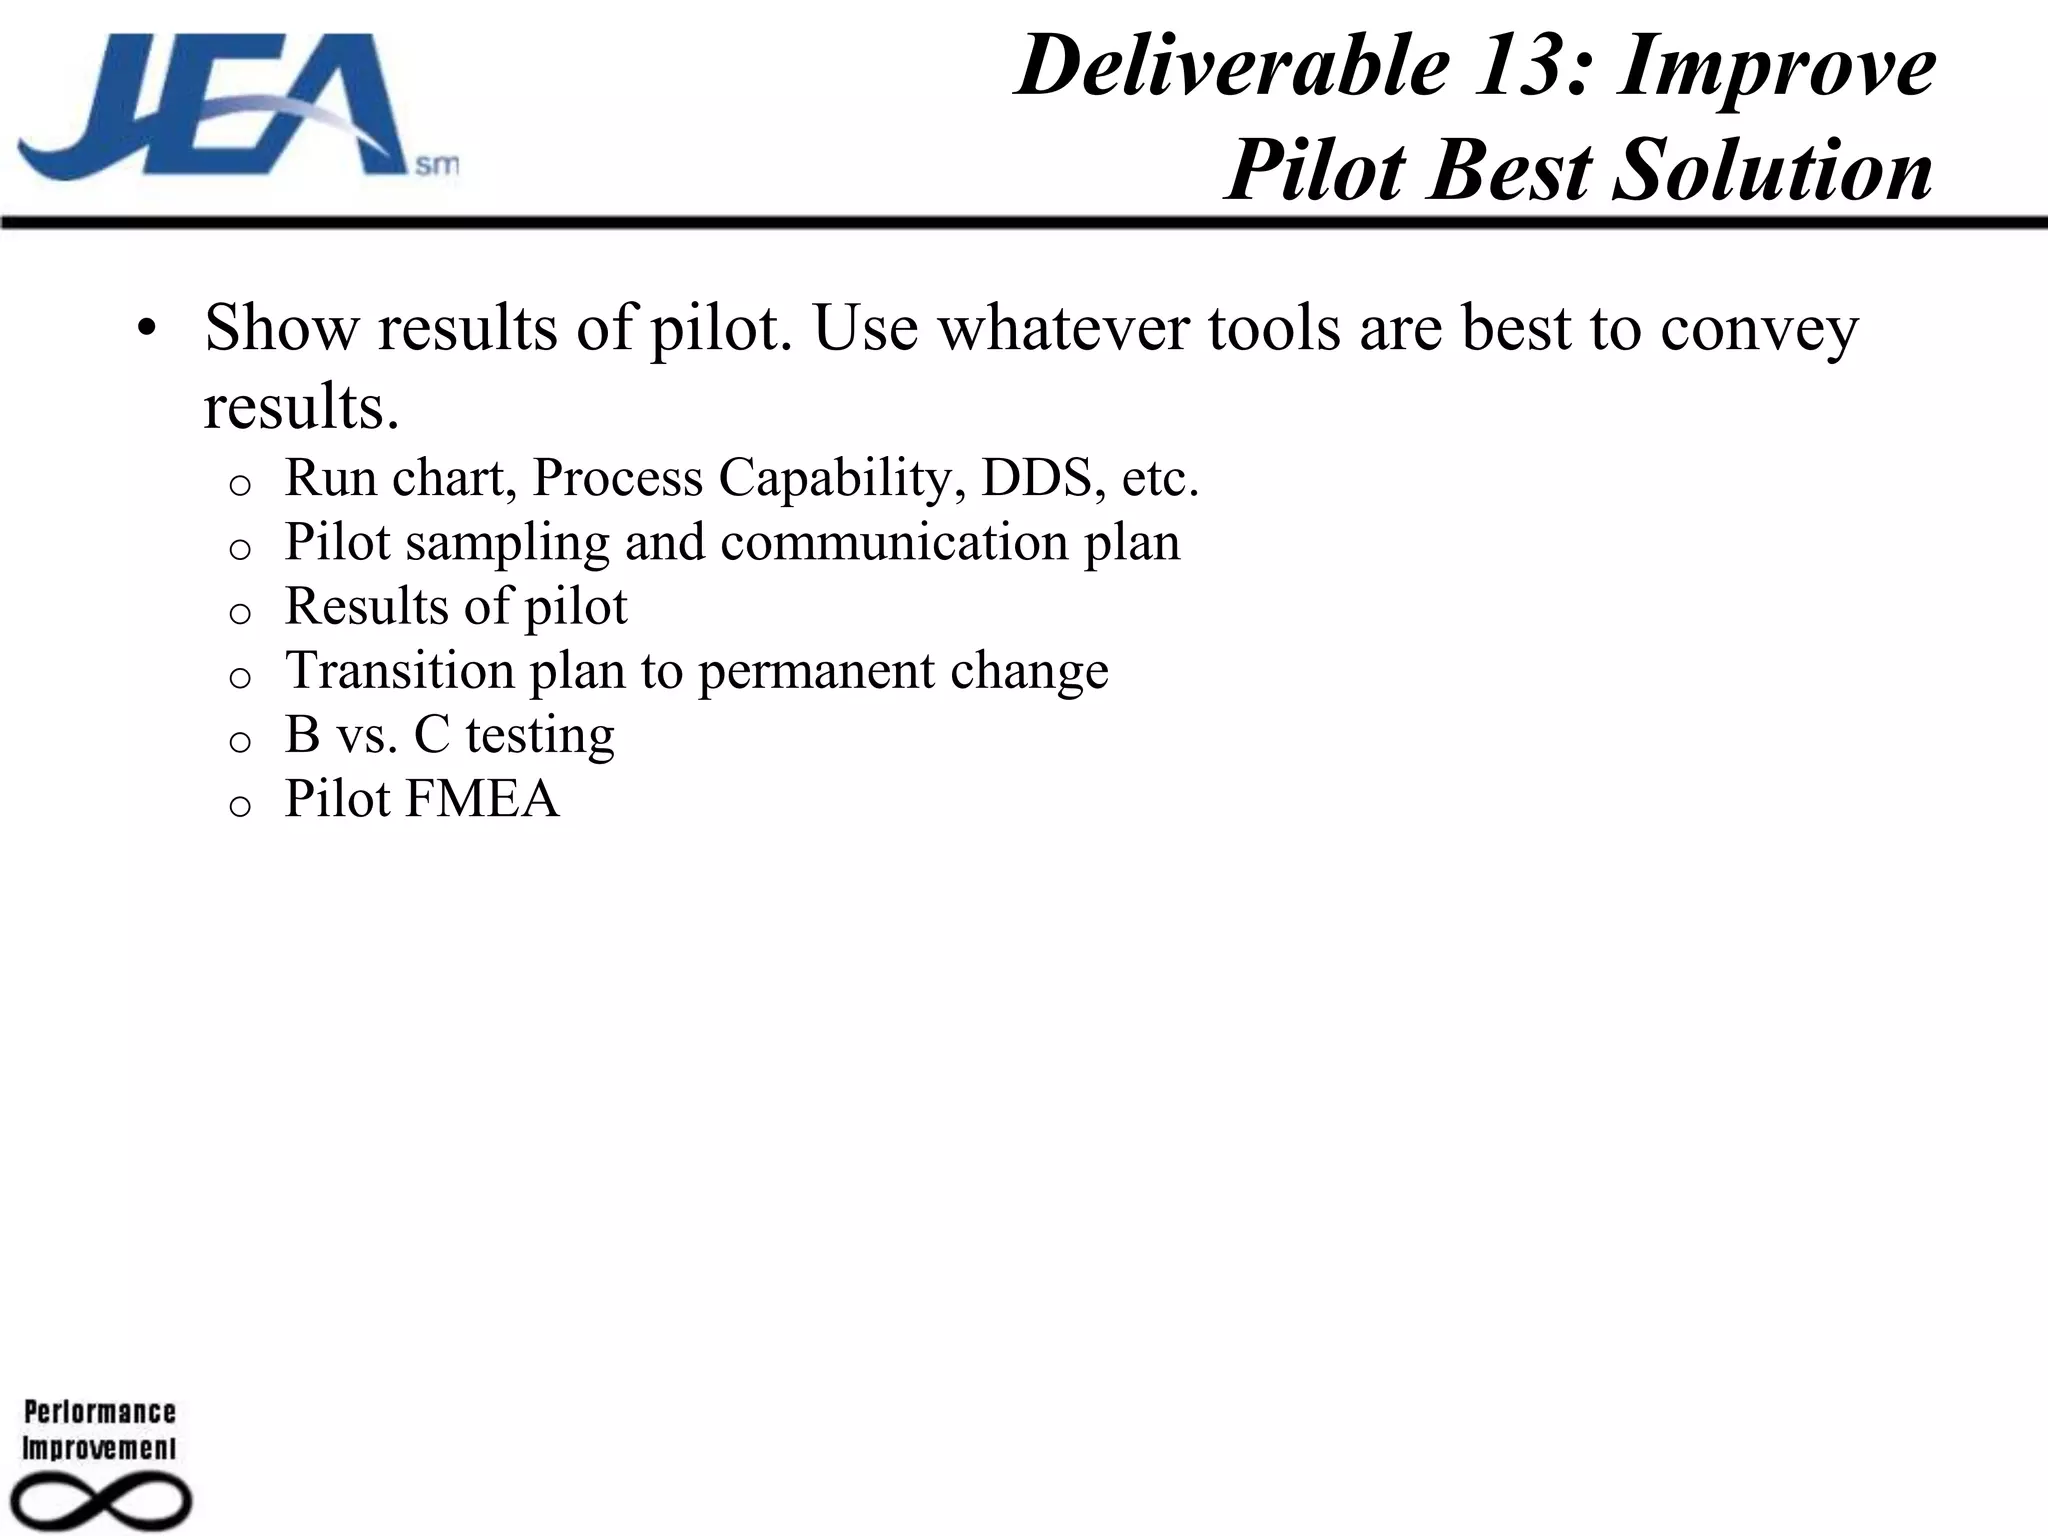
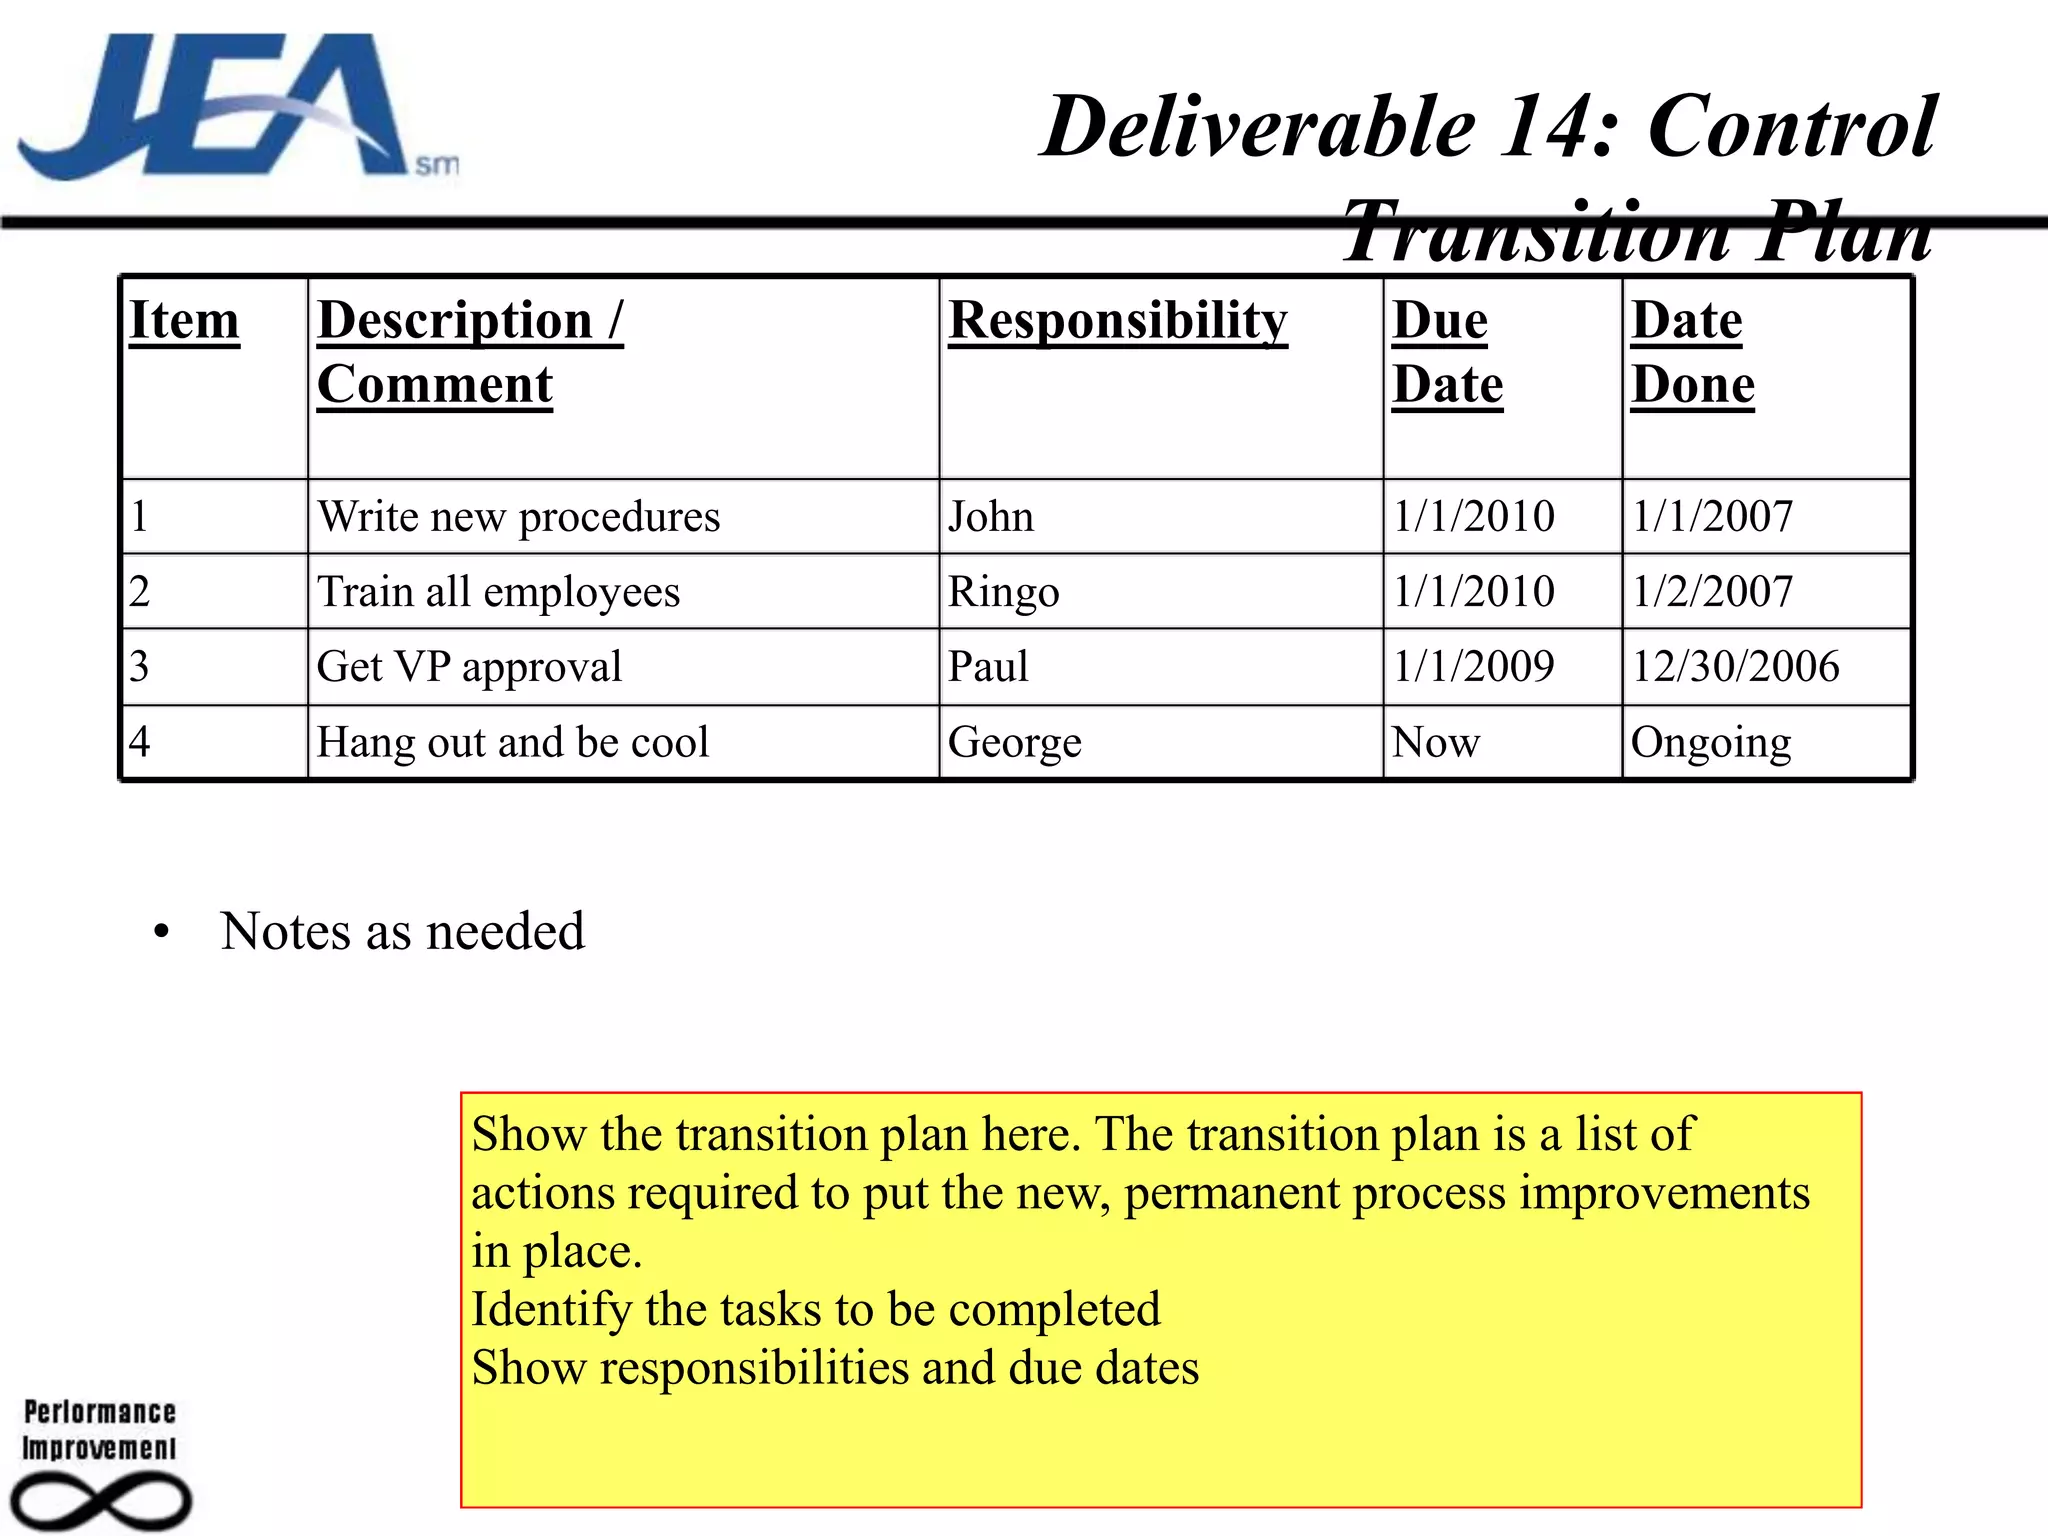
The document provides guidance for project tollgates, focusing presentations on satisfying 15 deliverables in each project phase and showing the logical thought process. Tollgate presentations should also list tasks and dates for the next phase, as well as barriers and assistance needed to complete the project on schedule. Projects are now performed using a standardized 15 deliverable format to guide tollgate reviews.
This document discusses project management techniques including project planning, scheduling, and controlling. It provides details on setting goals and defining tasks, organizing teams, estimating time and costs, and developing schedules. Techniques like Gantt charts, critical path method (CPM), and program evaluation and review technique (PERT) are presented for sequencing activities and determining critical paths. The importance of monitoring resources, costs, quality, and budgets during a project is also highlighted.
Probability Distribution Fitting of Cost Overrun Profilespedlove
This document summarizes a presentation on modeling cost overruns using probability distributions. It discusses common causes of cost overruns such as unrealistic estimates and scope changes. It also examines using different probability distributions like the normal, Frechet, and Cauchy distributions to model cost overrun data based on contract value. The results show an average 12.22% cost overrun across projects, with no significant differences found between project types, procurement methods, or contract size.
The document discusses computer simulation as a tool for process improvement. It defines computer simulation as using a computer model to simulate a real system. The basic steps for computer simulation are: 1) define the problem, 2) map the process, 3) define inputs, 4) build the model, 5) validate the model, 6) perform simulations, 7) interpret results, and 8) recommend and document solutions. Reasons for using simulation include testing changes without risk or time constraints, understanding bottlenecks, and validating expected improvements. Simulation should not be used without proper training or understanding, or when simpler methods can achieve the goal.
This document defines the key deliverables and tasks for quantifying the value of a project. Deliverable 3D involves quantifying the project value by determining the benefits to customers and the organization. This includes calculating the cost of poor quality using baseline data and estimating savings. Project benefits are documented in the project benefit document and summarized in the project charter and final presentation.
The document discusses the process for identifying and selecting projects for black belts. It provides criteria for project selection such as the problem being related to key business issues and having organizational support. It also describes documenting potential projects with a project charter that includes details like the customer and process owner. Project ideas are evaluated based on their estimated financial impact and strategic importance to prioritize resources.
This document provides an overview of hypothesis testing basics and confidence intervals. It discusses key concepts such as population parameters versus sample statistics, the central limit theorem, and variability of means. It also covers confidence intervals when the population standard deviation is known and unknown. Examples are provided to demonstrate how to calculate confidence intervals for the mean. The goal is to introduce statistical tests and understand how sample sizes influence results.
This document appears to be a template for documenting a Lean event from start to finish. It includes sections for defining the problem and goals, analyzing the baseline process, planning and executing improvements during the event, and controlling the new process afterwards. The template provides guidance on including details such as metrics, stakeholders, process maps, plans for transitioning and training, and tools for ensuring the benefits are sustained long-term.
This document provides information about measuring process improvement for the National Guard Black Belt Training Module 15. It outlines an 8-step CPI roadmap for measurement, including defining the problem, identifying performance gaps, setting improvement targets, determining root causes, developing countermeasures, seeing results through countermeasures, confirming results, and standardizing successful processes. It also lists tools that can be used during the measurement process, such as process mapping, data collection plans, control charts, and process capability analysis. Finally, it outlines the mandatory and recommended deliverables required to pass the measure tollgate, including current state process maps, metrics, operational definitions, baseline statistics, estimated benefits, and barriers/risks.
The document provides an overview of the Power Steering project tracking tool used by the National Guard for continuous process improvement projects. It describes how to access and navigate Power Steering, the roles and responsibilities of Black Belts in using it to track project progress, and how to invite new users. The learning objectives are to understand how to use Power Steering to navigate, track projects, and share best practices.
This document discusses key factors in determining sample size for statistical analysis: alpha risk, beta risk, delta or difference, and proportion or standard deviation. It provides examples of calculating sample size using Minitab for a wastewater treatment example, and discusses selecting a random sample from a larger data set.
The document discusses identifying root cause relationships as part of a quality improvement process. It explains that before developing solutions to identified root causes, their relationships to environmental concerns like climate change, conservation, and protecting resources must be examined. A relationship matrix tool is presented for mapping which environmental issues need consideration for each root cause when developing countermeasures. The objective is to ensure improvements also advance the organization's environmental performance.
This document provides an agenda and overview for a JEA Process Improvement Black Belt training on defining projects using the Six Sigma DMAIC methodology. It outlines the schedule and expectations for the define training week, including introducing the 15 deliverable format, methodology and tools for the define phase. It also covers emergency evacuation procedures and codes of conduct for the training.
This document provides a flowchart to guide users in selecting the appropriate hypothesis test based on the type of data (continuous or discrete variables), number of variables, assumptions of the data, and other factors. It outlines hypothesis test categories and provides decision trees to navigate through options for continuous and discrete dependent and independent variables, from parametric to non-parametric tests. It also includes sections on control charts and considerations for chart selection based on data type, subgroup size, and sampling versus census data.
This document discusses quick changeover techniques to improve process efficiency. It begins by outlining an 8-step process improvement methodology. It then defines changeover times and differentiates between traditional and lean thinking regarding changeovers. The key steps to reducing changeover times are identified as separating internal and external changeover activities, converting internal activities to external where possible, and reducing all remaining activities through techniques like parallel operations and automation. The goal is to standardize and simplify changeovers to allow for smaller batch sizes and increased flexibility.
The document provides instructions for a team to design and launch a balsa wood airplane to hit a target representing a varmint from 12-20 feet away. The team must use the Six Sigma DMAIC process to develop the airplane and launching system, and document their work in a presentation. They will be scored on accuracy in hitting the target from different distances and involvement of all team members. Payments will be made depending on whether the plane hits the target in flight or after landing.
The document outlines the steps to complete Deliverable 2D - Define Project Boundaries, which includes drafting a problem statement, defining the project scope using tools like SIPOC and a project charter, and estimating benefits. It provides objectives for defining boundaries such as constructing a problem statement and goal statement. It also notes that aspects of other define deliverables may be reflected in the project charter.
This document provides information on the 8-step CPI Roadmap process for improvement projects and the requirements to pass through the "Improve" tollgate. The 8 steps are: 1) Validate the problem 2) Identify performance gaps 3) Set improvement targets 4) Determine root cause 5) Develop countermeasures 6) See countermeasures through 7) Confirm results 8) Standardize successful processes. The tollgate requirements include delivering a solution prioritization, future state process map, implementation plan, pilot plan and results, process capability analysis, control charts, storyboard and barriers/risks identification.
This document provides guidance on using statistical tests to determine which process inputs (X's) are critical and influence outcomes (Y's). It outlines common statistical tests for continuous and discrete data, including tests for normality, one-sample t-tests to compare a mean to a target, and one-sample sign tests to compare a median when data is not normal. Examples are provided to illustrate how to use Minitab to conduct these tests and interpret the results.
This document provides an overview of Project Management Deliverable 4D, which is to develop a project management plan. It lists the primary and secondary tools used, including developing a communication plan, creating a project schedule in Excel or MS Project, establishing team consensus, and facilitating effective meetings. The goals are to identify team members, interface with stakeholders, and develop a project plan with milestones and timelines to effectively manage the project.
AFSO21 is the Air Force's standardized approach to continuously improve processes through lean principles in order to increase productivity, equipment availability, response time, safety, and energy efficiency. It utilizes lean methodology including specifying value, identifying the value stream, establishing flow without waste, pursuing perfection, and engaging Airmen. The goal is to eliminate non-value added activities and waste through relentless process improvement.
This document appears to be a template for Lean event documentation. It includes sections for defining the problem and goals, documenting the current process, identifying areas for improvement, planning the new process, ensuring implementation of changes, and controlling the new process. The template provides guidance on the type of information, format, and level of detail needed for each section to fully capture the Lean event and ensure successful implementation and sustainability of improvements.
This document discusses rapid improvement events (RIEs) and quick improvement methods for processes. It describes:
1) RIEs as a facilitated event lasting 3-5 days where a cross-functional team makes rapid improvements to an identified process problem. Documentation is completed during the event.
2) Quick improvements called "Just Do Its" that can bypass analysis and implement low-risk, fast changes identified early in a project using basic tools.
3) The criteria for "Just Do Its" as having minimal costs, low risk, quick implementation within 1-2 weeks, and authority to make the changes. Control plans must still be implemented after quick improvements.
The document discusses change management and outlines an 8-step process for continuous process improvement. It identifies common cultural types in organizations and how they can present barriers to change. The document also examines the characteristics of successful and unsuccessful change initiatives, barriers to change, and elements needed to successfully implement change.
This document provides guidance on using statistical tests to determine which process inputs (X's) are critical and impact the process output (Y). It outlines common statistical tests for continuous and discrete data, including tests for normality, 1-sample t-tests, and 1-sample sign tests. Steps are provided to gather input data, apply appropriate hypothesis tests to verify which X's are critical, and list the critical X's.
This document provides an overview of process mapping and value stream mapping techniques used in process improvement. It outlines an 8-step process improvement roadmap and discusses activities like process mapping, value stream mapping, and developing future state maps. The goal is to develop skills in process analysis to identify waste and improvement opportunities by mapping material, information, and workflow. Process mapping helps analyze problems, identify gaps, and plan improvement projects.
This document discusses key factors in determining sample size for statistical analysis: alpha risk, beta risk, delta or difference, and proportion or standard deviation. It provides examples of calculating sample size using Minitab for a wastewater treatment example comparing two processing lines, and selecting a random sample from a larger data set. The homework asks the reader to calculate sample sizes needed to determine if an invoice defect rate is different than 10% if the observed rates are 12%, 15%, 20%, or 25%.
The document provides information on analyzing processes to determine root causes of issues. It discusses an 8-step process that includes identifying performance gaps, determining root causes, developing countermeasures, and standardizing successful processes. Basic analysis tools covered are brainstorming, cause-and-effect diagrams, affinity diagrams, Pareto charts, and using Minitab. The tools help generate and organize ideas to identify potential root causes and improvements to address issues.
The document provides information about selecting solutions for process improvement projects. It discusses an 8-step problem solving process and lists tools that can be used, including brainstorming, process mapping, and selection matrices. The objectives are to understand idea generation principles, apply brainstorming tools, and use methods to select improvement ideas. Sources of solutions are identified, such as root causes, best practices, and past projects. Guidelines are given for generating many ideas through techniques like brainstorming and building on others' suggestions. Rules for effective brainstorming include allowing ideas without criticism and focusing on quantity over quality initially.
The document discusses:
1. The action research model is the basic model underlying most OD activities, which involves a cyclical process of data gathering, diagnosis, action planning, implementation, and evaluation.
2. Key features of action research include being problem-focused, action-oriented, collaborative, experimental, and aimed at tackling future problems.
3. The role of the action researcher includes problem definition, study design, data collection/analysis, interpretation, and planning/executing interventions.
This document outlines a framework for business process improvement projects that includes selecting projects, defining the current process baseline, performing a value-add analysis, improving the process, implementing changes, and following up on results. The goals are to select projects aligned with strategic objectives, identify improvement opportunities, define an efficient target process, implement changes to realize benefits, and communicate outcomes.
This document discusses various project scheduling techniques and processes. It defines activities, sequences activities, estimates activity resources and durations, develops the schedule network, and controls the schedule. Key processes covered include defining activities, sequencing activities, estimating activity resources and durations, developing the schedule, and controlling the schedule. The document also discusses decomposition, rolling wave planning, activity attributes, precedence diagramming, resource calendars, bottom-up estimating, resource breakdown structures, analogous estimating, program evaluation and review technique (PERT), schedule network analysis, resource leveling, the schedule baseline, and variance analysis.
The document discusses a proposed update to the Critical Path Theory called Critical Path 2.0. A working group was formed to address issues with the original Critical Path 1.0 theory and develop Critical Path 2.0. Key differences between the two theories include Critical Path 2.0 accounting for constraints like resources, dates, and calendars when identifying the critical path, whereas Critical Path 1.0 does not fully consider these constraints. The working group aims to publish a paper on Critical Path 2.0 to elevate scheduling standards and practices.
Practical Strategies for Project Recovery Webinar SlidesPM Solutions
Organizations spend a lot of money on projects. In the last year alone, the average firm closed US$200 million in projects, according to a just-released study conducted by PM Solutions Research. And more than a third of those projects were troubled. That means US$74 million of those projects were at risk of failure. The good news is that project recoveries are common and firms that proactively undertake successful project recoveries report saving US$50 million on average per firm. Learn what other organizations are doing to recover troubled projects and the significant business results they have been able to realize.
The document discusses different methods for successful project delivery through proper communication, documentation, and teamwork. It emphasizes defining requirements, establishing consensus through meetings and documentation, and coordinating among project managers, developers, and stakeholders. The approach involves keeping the project's goals in sight by defining objectives at each stage, assigning responsibilities, scheduling deliverables and resources, and ensuring effective communication throughout the project lifecycle from planning to delivery.
This document provides information for Achievement Standard 90342 related to developing and modeling a conceptual design in information and communication technology at NCEA Level 2. It includes 6 credits and involves identifying issues, formulating a brief, planning ongoing development work, and using modeling media to develop and demonstrate a conceptual design that addresses the identified issue. Key factors, stakeholders, and the viability of the conceptual design are prioritized for Merit and Excellence criteria. Planning tools, evidence of planning, and key stakeholders are also defined.
Engineering design is a process that applies science and math principles to optimally convert resources to meet a stated objective. It involves research, modeling, implementing, measuring, and communicating. The engineering design cycle includes input, research, modeling, implementing, measuring, and communicating output. Tools used in engineering design include functional decomposition or block diagrams to break down a system, Gantt charts for project scheduling, and a project manager to balance cost, schedule, and performance. Defining and specifying a project outlines precisely what is to be done under the constraints to achieve an optimal outcome.
This document discusses integrating technical risk management with decision analysis. It notes that NASA currently manages risks individually without considering overall risk. The document proposes using decision analysis and probabilistic risk assessment to evaluate alternatives based on performance measures related to objectives like safety, cost and schedule. This would allow uncertainty to be considered and provide a more rigorous approach to risk-informed decision making.
This document discusses assessing project alternatives through trade-off analysis in a strategic project management environment. It describes how trade-off analysis provides a tool for project managers to balance project constraints while shortening project length. It advocates for a systematic approach to strategic planning and trade-off analysis that involves comprehensive upfront planning, defining customer expectations, quantifying deliverables, and establishing guidelines to facilitate decision making during project implementation.
Forum One Web Executive Seminar Series: Internet Technology Investment Planni...Forum One
This presentation was given by Kris Mathisen, the Vice President of Services for Cognitive Technologies during Forum One's Web Executive Seminar Series at the National Press Club in Washington DC on June 21st, 2007.More information at http://www.forumone.com/content/calendar/detail/2169 . Contact: Kurt Voelker / kvoelker@ForumOne.com .
WBS And Scheduling for eLearning Project ManagamentMichael M Grant
This document discusses various aspects of eLearning project management including work breakdown structures (WBS), scheduling, and Gantt charts. It describes how to identify and organize project tasks in a WBS using a top-down approach. The importance of sequencing tasks and identifying dependencies is covered as well as estimating durations and assigning resources. Network diagrams and critical paths are explained for scheduling purposes. Finally, the document provides an overview of how Gantt charts can be used to display project schedules and track task progress over time.
Full portfolio of work for nom.bravo internal food ordering process at Nerdery Interactive Labs.
Included: process plan; project definition; process research; user research; heuristic analysis; information architecture (mental map, process flow, site map); interface design/wireframes.
Portfolio created by John E. Thompson.
A summary of Cliff Consulting\'s way of helping clients reduce costs in their project portfolio, while increasing their chances of success in the most critical projects
This document provides an overview of project chartering for continuous process improvement (CPI) projects. It discusses selecting CPI projects, developing a project charter, and who is responsible for chartering a project. The project charter defines the team's mission and includes the opportunity/problem statement, business case, goal statement, project scope, timeline, and team selection. It is a living document that may change over time. Developing an effective charter involves scoping the project based on the identified problem and determining proportional benefits, measurements, and boundaries.
Tg science q2 efficient energy transferComp Lab Man
The document outlines a 15-day unit on efficient energy transfer for secondary students. It includes:
1) Performance standards requiring students to advocate for efficient energy use through a group project.
2) Topics on energy transfer, conservation of energy, and human impacts on the thermal environment.
3) A stage 2 product where students conduct an advocacy activity assessed on criteria like creativity, relevance, and cooperation.
4) A stage 3 teaching sequence where students assess prior knowledge, learn about efficient energy transfer, and use various resources to understand topics like heat and thermal energy transfer.
The document outlines the Define, Measure, Analyze, Improve, and Control (DMAIC) process for a Lean Six Sigma project. It provides details on the key deliverables for the Define phase, including:
1) Define VOC, VOB, and CTQs to understand the customer problem and specifications;
2) Define the project boundaries and scope through a problem statement, process mapping, and project charter;
3) Quantify the project value by calculating the costs of poor quality;
4) Develop a project management plan identifying stakeholders, communication plans, milestones, and timelines.
The document provides an introduction to Six Sigma, defining it as a management philosophy that aims to reduce defects in processes. It discusses the Six Sigma definition and process, including the DMAIC and DMADV methodologies. It also outlines the roles of Green Belts, Black Belts, and Master Black Belts in executing Six Sigma projects and processes.
This document provides an overview of simple linear regression modeling. It defines key regression terminology like independent and dependent variables. It explains how to visualize relationships between variables using scatter plots and how to calculate correlation coefficients. While correlation does not necessarily imply causation, regression can be used to generate prediction models. The document reviews best practices like planning data collection and model validation. It provides examples of applying regression in administrative, market research, and hospitality contexts.
This document provides an overview of multiple regression analysis techniques. It begins with an introduction to multiple regression, explaining how it allows modeling of a dependent variable (Y) based on multiple independent variables (X1, X2, X3, etc). The document then outlines the basic steps for developing a multiple regression model, including visualizing relationships in the data, assessing correlation, generating a prediction equation, and validating the model. An example involving silver consumption in a production plant is presented to demonstrate these steps. The goal is to help readers understand how to identify correlation between variables, create mathematical models with multiple inputs, and examine a regression model.
A review of the growth of the Israel Genealogy Research Association Database Collection for the last 12 months. Our collection is now passed the 3 million mark and still growing. See which archives have contributed the most. See the different types of records we have, and which years have had records added. You can also see what we have for the future.
বাংলাদেশের অর্থনৈতিক সমীক্ষা ২০২৪ [Bangladesh Economic Review 2024 Bangla.pdf] কম্পিউটার , ট্যাব ও স্মার্ট ফোন ভার্সন সহ সম্পূর্ণ বাংলা ই-বুক বা pdf বই " সুচিপত্র ...বুকমার্ক মেনু 🔖 ও হাইপার লিংক মেনু 📝👆 যুক্ত ..
আমাদের সবার জন্য খুব খুব গুরুত্বপূর্ণ একটি বই ..বিসিএস, ব্যাংক, ইউনিভার্সিটি ভর্তি ও যে কোন প্রতিযোগিতা মূলক পরীক্ষার জন্য এর খুব ইম্পরট্যান্ট একটি বিষয় ...তাছাড়া বাংলাদেশের সাম্প্রতিক যে কোন ডাটা বা তথ্য এই বইতে পাবেন ...
তাই একজন নাগরিক হিসাবে এই তথ্য গুলো আপনার জানা প্রয়োজন ...।
বিসিএস ও ব্যাংক এর লিখিত পরীক্ষা ...+এছাড়া মাধ্যমিক ও উচ্চমাধ্যমিকের স্টুডেন্টদের জন্য অনেক কাজে আসবে ...
This presentation was provided by Steph Pollock of The American Psychological Association’s Journals Program, and Damita Snow, of The American Society of Civil Engineers (ASCE), for the initial session of NISO's 2024 Training Series "DEIA in the Scholarly Landscape." Session One: 'Setting Expectations: a DEIA Primer,' was held June 6, 2024.
The simplified electron and muon model, Oscillating Spacetime: The Foundation...RitikBhardwaj56
Discover the Simplified Electron and Muon Model: A New Wave-Based Approach to Understanding Particles delves into a groundbreaking theory that presents electrons and muons as rotating soliton waves within oscillating spacetime. Geared towards students, researchers, and science buffs, this book breaks down complex ideas into simple explanations. It covers topics such as electron waves, temporal dynamics, and the implications of this model on particle physics. With clear illustrations and easy-to-follow explanations, readers will gain a new outlook on the universe's fundamental nature.
This slide is special for master students (MIBS & MIFB) in UUM. Also useful for readers who are interested in the topic of contemporary Islamic banking.
Assessment and Planning in Educational technology.pptxKavitha Krishnan
In an education system, it is understood that assessment is only for the students, but on the other hand, the Assessment of teachers is also an important aspect of the education system that ensures teachers are providing high-quality instruction to students. The assessment process can be used to provide feedback and support for professional development, to inform decisions about teacher retention or promotion, or to evaluate teacher effectiveness for accountability purposes.
Macroeconomics- Movie Location
This will be used as part of your Personal Professional Portfolio once graded.
Objective:
Prepare a presentation or a paper using research, basic comparative analysis, data organization and application of economic information. You will make an informed assessment of an economic climate outside of the United States to accomplish an entertainment industry objective.
Main Java[All of the Base Concepts}.docxadhitya5119
This is part 1 of my Java Learning Journey. This Contains Custom methods, classes, constructors, packages, multithreading , try- catch block, finally block and more.
Thinking of getting a dog? Be aware that breeds like Pit Bulls, Rottweilers, and German Shepherds can be loyal and dangerous. Proper training and socialization are crucial to preventing aggressive behaviors. Ensure safety by understanding their needs and always supervising interactions. Stay safe, and enjoy your furry friends!
Exploiting Artificial Intelligence for Empowering Researchers and Faculty, In...Dr. Vinod Kumar Kanvaria
Exploiting Artificial Intelligence for Empowering Researchers and Faculty,
International FDP on Fundamentals of Research in Social Sciences
at Integral University, Lucknow, 06.06.2024
By Dr. Vinod Kumar Kanvaria
Executive Directors Chat Leveraging AI for Diversity, Equity, and InclusionTechSoup
Let’s explore the intersection of technology and equity in the final session of our DEI series. Discover how AI tools, like ChatGPT, can be used to support and enhance your nonprofit's DEI initiatives. Participants will gain insights into practical AI applications and get tips for leveraging technology to advance their DEI goals.
Strategies for Effective Upskilling is a presentation by Chinwendu Peace in a Your Skill Boost Masterclass organisation by the Excellence Foundation for South Sudan on 08th and 09th June 2024 from 1 PM to 3 PM on each day.
How to Add Chatter in the odoo 17 ERP ModuleCeline George
In Odoo, the chatter is like a chat tool that helps you work together on records. You can leave notes and track things, making it easier to talk with your team and partners. Inside chatter, all communication history, activity, and changes will be displayed.
A Strategic Approach: GenAI in EducationPeter Windle
Artificial Intelligence (AI) technologies such as Generative AI, Image Generators and Large Language Models have had a dramatic impact on teaching, learning and assessment over the past 18 months. The most immediate threat AI posed was to Academic Integrity with Higher Education Institutes (HEIs) focusing their efforts on combating the use of GenAI in assessment. Guidelines were developed for staff and students, policies put in place too. Innovative educators have forged paths in the use of Generative AI for teaching, learning and assessments leading to pockets of transformation springing up across HEIs, often with little or no top-down guidance, support or direction.
This Gasta posits a strategic approach to integrating AI into HEIs to prepare staff, students and the curriculum for an evolving world and workplace. We will highlight the advantages of working with these technologies beyond the realm of teaching, learning and assessment by considering prompt engineering skills, industry impact, curriculum changes, and the need for staff upskilling. In contrast, not engaging strategically with Generative AI poses risks, including falling behind peers, missed opportunities and failing to ensure our graduates remain employable. The rapid evolution of AI technologies necessitates a proactive and strategic approach if we are to remain relevant.
1. Tollgate Guiding Thoughts
• Projects are now performed per the 15 deliverable format. As such, project
tollgates will focus on the work done in each phase to satisfy the 15
deliverables. Note that slides are sequenced from deliverable to deliverable.
• Tollgates should focus on showing the thought process through the phase.
The deliverables and primary tools are structured/selected to show this
logical flow for most projects. Primary tools are not mandatory use tools,
but they will usually be the best way to show the project progression. Use
and show secondary tools as needed to aid working a project.
• After showing the work done to complete a phase, each presentation should
have a slide which lists the tasks and associated dates for the next phase.
Highlight any expected barriers to the project and describe what assistance
is needed from the Champion, PO, etc. to complete the project per that
timeline.
2. DMAGIC Focus by Phase
1. Define VOC, VOB and CTQs
Y
Define 2. Define Project Boundaries
Y=ƒ(x)
o SIPOC, Project Charter
3. Quantify Project Value
Better o COPQ, Customer Satisfaction
4. Develop Project Management Plan
1. Document the Process
Measure 2. Prioritize List of X’s
Y= ƒ(x)
3. Create a Data Collection Plan
4. Validate Measurement System
5. Establish Baseline Process Capability
Analyze 1. Determine Critical X’s
o Use statistical and graphical tools to
Y= ƒ(x) verify and quantify X-Y
relationships
1. Investigate interactions between root causes
Green It Up and the project environment
Y= ƒ(x)
2. Investigate interactions between root causes
and the process environment
3. Establish bounds of possible
countermeasures to maximize the positive
impact of the project
Time to Imple- Cost vs. Bene-
Impact on Root
Cause
ment fit Acceptance
Action
1. Prioritized List of Solutions
X’s Solutions
#1
Y/N
Improve o Computer Simulation
Verified N
Y= ƒ(x)
Root
Cause # 1
#2 Y o Process Standardization
N
Y
#3
o DOE
#4 N
Verified
Root Y
o Decision Matrix
Cause # 2 #5
Y
2. Pilot Best Solution
Verified #6
Root N
#7
Cause # 3
1. Create Control System
Control o Control Plan
Y= ƒ(x)
Better
o Mistake Proof
o Control Charts
2. Finalize Project Documentation
o Final COPQ Summary
o Update Process Capability
o Final Project Presentation
3. <Project Title>
<Review Date>
BB: (Name)
Champion: (Name)
Assigned Define Measure Analyze Green Improve Control
Sched Date Date Date Date Date Date Date
Actual Date Date Date Date Date Date Date
5. Deliverable 1: Define
Define VOC, VOB
• Voice of the customer
• Voice of the business
• Include any operating definition on this or a separate slide
For this and all subsequent phases, add charts as appropriate to show
“the story” for that phase. Example – a descriptive statistics chart is
not listed with any specific deliverable, but it would probably be
appropriate to show in the Define section.
6. Customer CTQ Tree
Need Drivers CTQ’s
Q1=
• . Driver 1
p1 =
Q2 =
Driver 2
p2 =
Q2 =
Driver 3
KPI =
General Specific
Hard to measure Easy to measure
7. Deliverable 1: Define
Pareto Charts/ Basic Graphs
Include Pareto Charts, trend charts, histograms etc to characterize existing
process.
Good!
The purpose of the chart(s) on this page is to explore what is
happening with the Y or Y’s that will make this an appropriate project
to execute. Plot your primary metric here.
8. Project Charter
{Project Name Here}
Customer CTQ(s): Describe customer CTQ Process Map Number: Number here
(customer need/defect and spec limit.)
Green Belt: Name here
Problem Statement: List the 4 elements of a Process Owner: Name here
problem statement: Champion: Name here
* Defect identification Implementation Coordinator: Name here
* Magnitude of the defect (events/unit time, etc) Data Coordinator: Name here
* Where is the defect (location/group/segment) Team Members:
* Why this project is important to work now Name & function here
($, strategy support, etc) Name & function here
Name & function here
Project Scope: Name & function here
List project/process boundaries here by using Name & function here
includes … and excludes …
Goal Statement: Increase(/decrease) the {primary Project Timeline:
metric} from {baseline state} to {improved state} by Assigned Define Measure Analyze Green Improve Control
{date} without negatively impacting {secondary Sched Date Date Date Date Date Date Date
metric}. Actual Date Date Date Date Date Date Date
Baseline Metric Performance (Time Frame here):
Short Term Long Term Expected Benefits:
Zbench x.x x.x Hard Savings –$ xxx K
DPMO xxxxxx xxxxxx
Soft Savings –$ xxx K
Other Benefits:
List benefit here
List benefit here
9. Deliverable 2: Define
Improve Computer Delivery Time Proj. No. 12345
Customer CTQ(s): Configured computer delivered to Process Map Number: 1234
new employee within 10 working days
Black Belt: I. Cantwait
Process Owner: Weneedta Getbetter
Problem Statement: From 7/1/08 through 6/30/08, new
Champion: Ima Gonnahelp
JEA employees located in downtown Jacksonville
Implementation Coordinator: Iwill Putinplace
received their configured laptop/desktop computer at an
Data Coordinator: Ilove Numbers
average of 11.0 days (standard deviation = 2.04) vs. a 10
Team Members:
day USL. This translates to an estimated productivity loss
John – Installer
of $225K/yr.
Paul – Installer
Project Scope: George – Supervisor
Includes new hires and transferred employees to the Ringo - Purchasing
downtown tower and CCC. Excludes all other locations
or electronic
Project Timeline:
Goal Statement: Decrease the average computer delivery Assigned Define Measure Analyze Green Improve Control
time from 11.0 days to 9.0 days by 11/20/08 without Sched 7/1/08 7/15/08 8/30/08 9/30/08 10/7/08 10/20/08 11/20/08
negatively impacting new computer inventory or
Actual 7/1/08 7/12/08 9/5/08 9/28/08
expediting costs.
Baseline Metric Performance (7/08-6/08): Example charter for
Expected Benefits:
Short Term Long Term
Hard Savings – $15 K project in Green
Zbench -0.72 -0.50
Soft Savings – $225 K phase
DPMO 763,253 692,088
Other Benefits:
Internal Customer Satisfaction Scores
11. Included/Excluded
INCLUDED EXCLUDED
• What __________________ • _____________________
• Where _________________ • _____________________
• When __________________ • _____________________
• Who ___________________ • _____________________
• Other __________________ • _____________________
12. Deliverable 3: Define
Quantify Project Value
• Hard $$ savings
This slide is to be submitted to Finance
• Soft $$ savings for review and approval. If necessary,
schedule a meeting to resolve any issues
about the approach for calculating dollar
• Productivity improvement impact to the business.
• Internal customer satisfaction
• External customer satisfaction
Describe Project Benefits in terms of COPQ, non-financial benefits, etc.
Show enough detail for reader to understand how COPQ is calculated as well as the
total value. Be sure to show
• $ broken down by savings category
• Cost Center number which will receive the savings
13. Savings Categories
• Revenue Growth - is used when a process change results in an increase in cash flow from existing
revenue sources or from a new revenue source. Revenues do not include liquidation of assets that
were not purchased for resale.
• Increased Capacity - is used when process changes result in additional benefits from existing
facilities. The amount to estimate depends on how the additional capacity will be used.
• Expense Reduction - for routine recurring O&M expenses that will be reduced in both current and
future years, as a result of a process change.
• Expense Avoidance - is used when a process change makes an anticipated future O&M expense
unnecessary.
• Capital Reduction - is like expense reduction except that it applies to capital budget expenditures
instead of O&M.
• Capital Avoidance - is like expense avoidance except that it applies to anticipated capital budget
expenditures not O&M.
• Inventory Reduction - is a “soft” dollar classification based on the presumption that the “carrying
cost” of inventory is 14.7% (as claimed in an old Stone & Webster study).
• Financial Adjustment - is intended to identify amounts associated with accounting changes.
• Cycle Time/ Productivity - is used to identify COPQ estimates for process changes that reduce time
and effort spent on tasks without a corresponding reduction in work force.
14. Deliverable 4: Define ; A.R.M.I.
Project Phase
Key Stakeholders Define Measure Analyze Green Improve Control
John M M M M M M
Paul A A A A A A
George R M M R R R
Ringo I R I I I
A - Approval of team decisions outside their charter/authorities, i.e., sponsor, business leader.
R - Resource to the team, one whose expertise, skills, “clout” may be needed on an ad-hoc basis.
M - Member of team, with the authorities and boundaries of the charter.
I - Interested party, one who will need to be kept informed on direction, findings, if later support is to be forthcoming.
15. Deliverable 4: Define; Project Plan
Show the Excel project plan template, Gantt chart, or other type of
project task & milestone summary here
16. Critical Checkpoints for Measure
Item Description / Responsibility Date
Comment
Use this slide to list the things the BB/team need help with in order
for the project to maintain the project schedule. Be specific. The
champion, PO, and all others should be clear on what they need to
do to help keep the project on schedule when they leave the
tollgate. If you need no specific actions on their part, state that as
well.
Measure tollgate Tollgate review BB, Champion, MBB, List date and time here
other (list names)
18. Deliverable 5: Measure
Document Existing Process
• Show a detailed process map here. This will produce a list of
X’s for the next deliverable.
o Sufficient detail to show X’s and key decisions
o List X’s for each process step
o List Y’s for each process step (This should include your primary metric)
20. Deliverable 6: Measure
XY Matrix
Show the XY Matrix here. Use it to take the X’s from the
previous phase and prioritize them for data gathering and analysis
21. Deliverable 6: Measure
Secondary Tools
• Show any secondary tools used to narrow the list of “possible
X’s” into a “most likely list of X’s” for data collection. These
tools could include:
• Graphical analysis
• Pareto charts
• Box plot
• Concentration diagram
• Histogram etc.
• Or Nothing
22. Deliverable 6: Measure
FMEA
Show the FMEA here. It takes the high
priority X’s from the XY matrix and refines
them for data gathering plus highlighting
any immediate fixes that can/should be put
in place until the final project
recommendations are developed
23. Deliverable 6: Measure
Focus of Investigation
• Project Ys
• Summary of prioritized list of potential X’s
24. Deliverable 6: Measure
Root Cause Investigation Matrix
Problem Probable / Statistical or Explain "WHY" - MBB Statistical Test
State-ment Possible Root Logical (Logic Flow for Con- or Description
“Y" Cause(s) "Xs" Analysis Verification Method) currs of non-Stat
Y/N Treatment
25. Deliverable 7: Measure
Data Collection Plan
• Show the Data Collection Plan here
• It should use the project Y and the X’s listed in deliverable 6
• How you collect your data should be guided to address any
issues from:
o Sampling strategy
o Auto correlation
26. Deliverable 8: Measure
Validate Measurement System
• Show how you validated the Y measurement system. If it was
with a GR&R, show the Minitab output.
o Data integrity audit
o Attribute R&R
o Gage R&R
o In-line gage R&R
27. Deliverable 9: Measure
Baseline Data Control Chart
• For the baseline data and/or the data collected to date (as appropriate), show the
Y data on a control chart.
• The purpose of this analysis is to show the process is in a state of control and
therefore appropriate for a capability analysis
28. Deliverable 9: Measure
Baseline Process Capability
• Show the process capability . If done in Minitab, show
Minitab output.
• Process capability analysis
• Box-Cox transformation if it is necessary
• Weibull & other non-normal distributions if the data can’t be transformed
29. Deliverable 9: Measure
Baseline Process Capability
Defect being assessed: Invoice Accuracy
Is this Short Term or Long Term data? Long Term
Sigma Shift (Set to 1.5 unless data indicates otherwise) 1.5
No. of Units Inspected 85
No. of Opportunities For Defects / Unit 1
No. of Defects observed in units inspected 3
Long Term DPMO (Defects Per Million Opportunities) 35294
Long Term Zbench (Sigma Level) 1.81
Short Term DPMO (Defects Per Million Opportunities) 470
Short Term Zbench (Sigma Level) 3.31
31. Critical Checkpoints for Analyze
Item Description / Responsibility Date
Comment
Use this slide to list the things the BB/team need help with in order
for the project to maintain the project schedule. Be specific. The
champion, PO, and all others should be clear on what they need to
do to help keep the project on schedule when they leave the
tollgate. If you need no specific actions on their part, state that as
well.
Analyze tollgate Tollgate review BB, Champion, MBB, List date and time here
other (list names)
33. Deliverable 10: Analyze
Root Cause Investigation Matrix
Problem Probable / Statistical or Explain "WHY" - MBB Statistical Test
State-ment Possible Root Logical (Logic Flow for Con- or Description
“Y" Cause(s) "Xs" Analysis Verification Method) currs of non-Stat
Y/N Treatment
34. Deliverable 10: Analyze
Determine Critical X’s
• Use as many slides as necessary to show how data was used to
assess which X’s from deliverable 6 are the true X’s for the
process. Typically, this section includes logical, graphical and
statistical analysis. You must address each X listed on the
RCIM with either logical or statistical analysis.
o Statistical tests
o Show which Xs cause changes in Y
35. Graph Selection
X Continuous X Discrete Data One Variable
Data
Y Contin- Scatter Plot Boxplot Graphical Summary
uous data Matrix Plot Dotplot Boxplot
Draftsman Plot Bar Chart Dotplot
Marginal Plot Pie Chart Histogram
Control Chart Multi-vari Normality
Run Chart
Y Discrete Run Chart Concentration Graphical Summary
Data Control Chart Diagram Pareto
Pareto
36. Deliverable 10: Analyze
Determine Critical X’s
Area 1 Area 2
Contributor 1 Contributor 1
Contributor 2 Contributor 2
Contributor 3 Contributor 3
Contributor 4 Contributor 4 Measurable
Contributor 4 Contributor 4 Result
Contributor 3 Contributor 3
Contributor 2 Contributor 2
Contributor 1 Contributor 1
Area 4 Area 3
37. Deliverable 10: Analyze
A Tree Diagram
1st cause why why why why why
1st cause why why
1st cause why why why why 1st cause why why why why why
why
1st cause why why 1st cause why why why why why
1st cause (level 2 why why why
1st cause why why why why why
from fishbone)
1st cause why why 1st cause why why why why why
1st cause why why why why
1st cause why why why why why
why
1st cause why why
1st cause why why why why why
why why
1st cause why why why why why
2nd cause why why why why why
2nd cause why why
2nd cause why why why why 2nd cause why why why why why
why
2nd cause why why 2nd cause why why why why why
2nd cause (level 2 why why why
2nd cause why why why why why
from fishbone)
2nd cause why why 2nd cause why why wh ywhy why
2nd cause why why why why
2nd cause why why why why why
why
2nd cause why why
2nd cause why why why why why
why why
2nd cause why why why why why
38. Deliverable 10: Analyze
Another Tree Diagram
1st cause why why why why why
1st cause why why
1st cause why why why why 1st cause why why why why why
why
1st cause why why 1st cause why why why why why
why why
1st cause why why why why why
1st cause why why 1st cause why why why why why
1st cause why why why why
1st cause why why why why why
why
1st cause why why
1st cause why why why why why
why why
1st cause why why why why why
1st cause (level 2 why
from fishbone)
2nd cause why why why why why
2nd cause why why
2nd cause why why why why 2nd cause why why why why why
why
2nd cause why why 2nd cause why why why why why
why why
2nd cause why why why why why
2nd cause why why 2nd cause why why wh ywhy why
2nd cause why why why why
2nd cause why why why why why
why
2nd cause why why
2nd cause why why why why why
why why
2nd cause why why why why why
39. Deliverable 10: Analyze
Determine Critical X’s
Item being investigated
Hypothesis: Describe what the team thinks is causing the poor results.
Method: Describe what specific method(s) you will use to prove or disprove the hypothesis.
Statistical Conclusion: List the results of your statistical tests and explain what the results mean.
Practical Conclusion: Describe your results using easily understood language.
40. Deliverable 10: Analyze
Determine Critical X’s
New Purchasing Ordering System
Hypothesis: The new purchasing system has reduced ordering time by 25%.
Method: We obtained random samples form the “before” process and the “after” process. We made sure
both samples were normally distributed. We then used a 2-Sample t test to compare the process before the
change and after the change.
Statistical Conclusion: The 2-Sample t test resulted in a p-value of 0.00. If the p-value is less that .05, we
can reject the Null hypothesis. The before and after process is different.
Practical Conclusion: The process ordering time has been reduced from 100 days to 36 days. That is a
64% reduction!
EXAMPLE
41. Deliverable 10: Analyze
Determine Critical X’s
Call Center Overflow Calls
Hypothesis: Inadequate staffing levels in the Call Center are causing an increased level of overflow calls.
Method: We used regression analysis to check for a relationship between staff levels and call overflow. We
compared the 15 minute staffing interval levels to the call overflows from the same period.
Statistical Conclusion: Regression analysis revealed a R-Squared of 6.7%. Call center staffing levels
alone do not explain the increased level of call overflow.
Practical Conclusion: Staffing levels do not explain the increase in call overflows. We need to look for
other causes of call overflow.
EXAMPLE
42. Deliverable 10: Analyze
Root Cause Investigation Matrix
Problem Probable / Statistical or Explain "WHY" - MBB Statistical Test
State-ment Possible Root Logical (Logic Flow for Con- or Description
“Y" Cause(s) "Xs" Analysis Verification Method) currs of non-Stat
Y/N Treatment
43. Critical Checkpoints for Green
Item Description / Responsibility Date
Comment
Use this slide to list the things the BB/team need help with in order
for the project to maintain the project schedule. Be specific. The
champion, PO, and all others should be clear on what they need to
do to help keep the project on schedule when they leave the
tollgate. If you need no specific actions on their part, state that as
well.
Green tollgate Tollgate review BB, Champion, MBB, List date and time here
other (list names)
45. Green Phase Guiding Thoughts
• Evaluating the project and process context is critical for the
selection of the best possible countermeasures to deploy.
• The Green Phase of the project is when the Improvement
Team stops to consider the relationships between each of the
identified critical X’s and our environment.
• It is the intent of every project to improve the performance
profile of the process that is the focus of the project. We must
also manage risk.
• During this phase we explore the relationships between each
root cause and the business outcomes that can be affected both
positively and negatively to assure the countermeasures to be
developed in the Improve Phase optimize the outcome of the
project.
46. Deliverable 11: Green It Up
Relationship Matrix
Show the Relationship Matrix here. Use it to take the critical X’s
from the Analyze Phase and determine their relationship to the
environment of the process being investigated.
47. Deliverable 11: Green It Up
Countermeasure Issue List
• Issues to consider during countermeasure development
48. Critical Checkpoints for Improve
Item Description / Responsibility Date
Comment
Use this slide to list the things the BB/team need help with in order
for the project to maintain the project schedule. Be specific. The
champion, PO, and all others should be clear on what they need to
do to help keep the project on schedule when they leave the
tollgate. If you need no specific actions on their part, state that as
well.
Improve tollgate Tollgate review BB, Champion, MBB, List date and time here
other (list names)
50. Deliverable 12: Improve
Prioritized List of Solutions
• Use as many charts as necessary to lead the audience through the flow of
work done in this phase. Example – if a DOE is performed, you may want to
use one chart to describe the DOE set-up, another to show the final Minitab
session window list of terms, and graphical charts as appropriate to convey
the results to your audience.
• If a Pugh or Criteria Decision Matrix are used, show those tools.
• Show best solution selection among alternate solutions
o Pugh matrix
o Criteria based decision matrix
o Computer simulation
o Risk assessment
o DOE
o DOE FMEA
51. Deliverable 12: Improve
Prioritized List of Solutions
Net Process Total 0 0 0 0 0 0 0
Sum of Better (+) 0 0 0 0 0 0 0
Sum of Worse (-) 0 0 0 0 0 0 0
Sum of "Same" (s) 0 0 0 0 0 0 0
Key Criteria for Comparison Design Design Design Design Design Design Design Design
Concept 1 Concept 2 Concept 3 Concept 4 Concept 5 Concept 6 Concept 7 Concept 8
(Baseline)
1
2
3
4
5
6
7
8
9
10
52. Deliverable 12: Improve
Criteria Based XY Matrix
Show the Criteria-based XY Matrix here. It takes the alternative
improvement strategies and them for decision-making about
which one or ones to pursue
53. Deliverable 13: Improve
Pilot Best Solution
• Show results of pilot. Use whatever tools are best to convey
results.
o Run chart, Process Capability, DDS, etc.
o Pilot sampling and communication plan
o Results of pilot
o Transition plan to permanent change
o B vs. C testing
o Pilot FMEA
54. Critical Checkpoints for Control
Item Description / Responsibility Date
Comment
Use this slide to list the things the BB/team need help with in order
for the project to maintain the project schedule. Be specific. The
champion, PO, and all others should be clear on what they need to
do to help keep the project on schedule when they leave the
tollgate. If you need no specific actions on their part, state that as
well.
Control tollgate Tollgate review BB, Champion, MBB, List date and time here
other (list names)
56. Deliverable 14: Control
Transition Plan
Item Description / Responsibility Due Date
Comment Date Done
1 Write new procedures John 1/1/2010 1/1/2007
2 Train all employees Ringo 1/1/2010 1/2/2007
3 Get VP approval Paul 1/1/2009 12/30/2006
4 Hang out and be cool George Now Ongoing
• Notes as needed
Show the transition plan here. The transition plan is a list of
actions required to put the new, permanent process improvements
in place.
Identify the tasks to be completed
Show responsibilities and due dates
57. Deliverable 14: Control
Dashboard / Control Plan
• Show the control measurement metrics and how they will be
monitored
• If the indicators required to control the process are included
on a Standard Process Map, include a copy of the new
Standard Process Map on a single slide.
58. Deliverable 15
Updated Process Capability
• Show the updated process capability graph/calculations here.
This sets a standard for future operation to meet.
• There are samples of attribute and continuous data capability
calculations with Deliverable 9 earlier in this presentation.
59. Deliverable 15
Updated Process Capability
• Show Before & After Graphs
60. Deliverable 15
Updated Process Capability
• Show statistical test of the improvement on the primary metric
• Two-sample T for Average Defect
• Stage N Mean StDev SE Mean
• Before 12 0.355 0.382 0.11
• Second 10 0.071 0.124 0.039
• Difference = mu (Before) - mu (Second)
• Estimate for difference: 0.284000
• 95% CI for difference: (0.020452, 0.547548)
• T-Test of difference = 0 (vs not =): T-Value = 2.25 P-Value = 0.036 DF
= 20
61. Deliverable 15
Updated Benefits Document
• Show the updated project benefits on the next slide.
• In deliverable 3, these were estimated. By deliverable 15, the
data will almost always show benefits to be somewhat
different than originally expected.
• PO, Champion, and MBB need to agree on benefits
calculations.
• Be sure to show
o $ broken down by TS savings category
o Cost Center number which will receive the savings
o Final posted version should state that savings have been reviewed with
Champion and that the Champion agrees with values
62. Deliverable 15
Updated Benefits Document
• Hard $$ savings
Final posted version of this slide
should state that savings have
• Soft $$ savings been reviewed with your
Champion and that the Champion
• Productivity improvement agrees with values. It is also to be
submitted to Finance for Audit
Review.
• Internal customer satisfaction
• External customer satisfaction
Describe Project Benefits in terms of COPQ, non-financial benefits, etc.
Show enough detail for reader to understand how COPQ is calculated as well as the
total value. Be sure to show
• $ broken down by savings category
• Cost Center number which will receive the savings
63. Deliverable 15 Final
Presentation/Closing Report
• This document is the final report for this project.
• Transition information to support the flow of the report is
included in the speaker notes.
• If there are further questions, please contact <Green Belt> at
665-XXXX
This document will suffice for a final presentation/closing report if the author uses the
speaker notes section to add whatever detail is needed to make this a stand alone
document. IE – a person who is unfamiliar with the project or process should be able to
view this presentation along with the speaker notes and understand what was done and
why. A presentation that simply shows the tools and relies on the speaker to
communicate the key points to the audience is not an adequate closing report.